
Detail Information of Mutation-induced Spatial Variation
| General Information of Drug Transporter (DT) | |||||
|---|---|---|---|---|---|
| DT ID | DTD0004 Transporter Info | ||||
| Gene Name | ABCG2 | ||||
| Transporter Name | Breast cancer resistance protein | ||||
| Gene ID | |||||
| UniProt ID | |||||
| Mutation-induced Spatial Variation (MSV) of This DT | |||||
| SNP ID | |||||
| Variation Type | F/S | ||||
| Site of GPD | chr4:88121701 (GRCh38.p12) | ||||
| Allele(s) in dbSNP | A>G | ||||
| Minor Allele Frequency | N.A. | ||||
| GPD Details | GPD Info | ||||
| Structure Details | |||||
| Modeling Method | Homology modeling | ||||
| Template PDB | 6ETI_A | Identity | 99.847% | ||
| Model Performance | Minimized Score | -1720.233 kcal/mol | |||
| Ramachandra Favored |
Excellent |
||||
| QMEANBrane Quality |
Medium |
||||
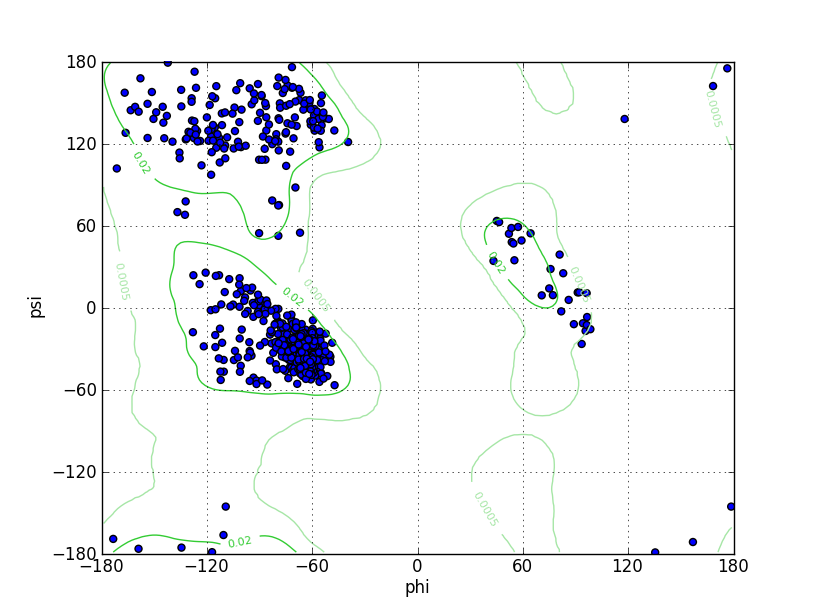
| Ramachandran Plot |
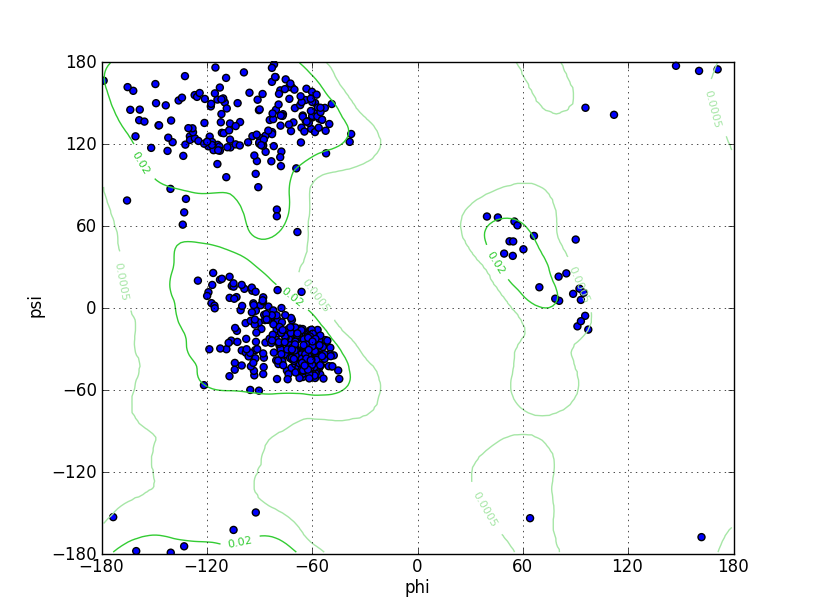
|
||||
| Click to Save Ramachandran Plot in PNG Format | |||||
| Ramz Z Score | -0.55 ± 0.31 | ||||
| Residues in Favored Region | 643 | Percentage of Favorable Residues | 98.47% | ||
| Number of Outliers | 0 | Ramachandran outliers | 0.00% | ||
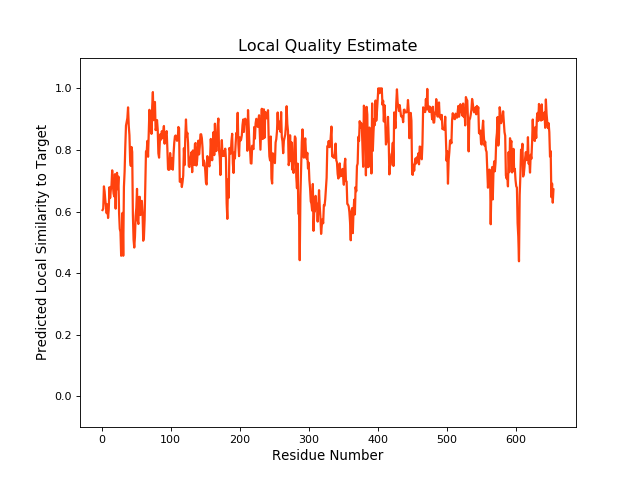
| Local Quality |
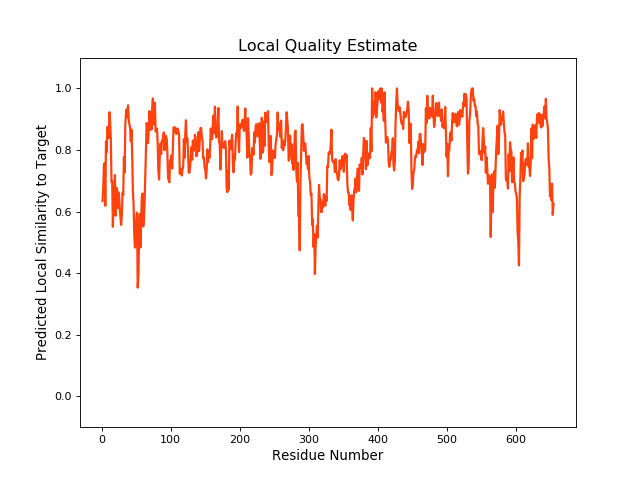
|
||||
| Click to Save Local Quality Plot in PNG Format | |||||
| QMEANBrane Score | 0.79 | ||||
| SNP ID | |||||
| Variation Type | V/M | ||||
| Site of GPD | chr4:88139962 (GRCh38.p12) | ||||
| Allele(s) in dbSNP | C>T | ||||
| Minor Allele Frequency | T=0.1575/789 | ||||
| GPD Details | GPD Info | ||||
| Structure Details | |||||
| Modeling Method | Homology modeling | ||||
| Template PDB | 6ETI_A | Identity | 99.847% | ||
| Model Performance | Minimized Score | -1729.484 kcal/mol | |||
| Ramachandra Favored |
Excellent |
||||
| QMEANBrane Quality |
Medium |
||||
| Ramachandran Plot |
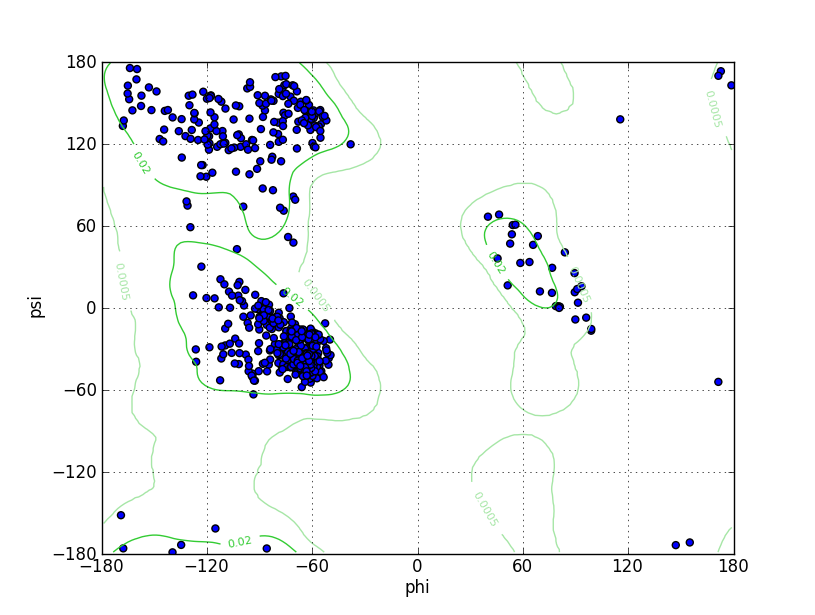
|
||||
| Click to Save Ramachandran Plot in PNG Format | |||||
| Ramz Z Score | -0.53 ± 0.3 | ||||
| Residues in Favored Region | 641 | Percentage of Favorable Residues | 98.16% | ||
| Number of Outliers | 0 | Ramachandran outliers | 0.00% | ||
| Local Quality |
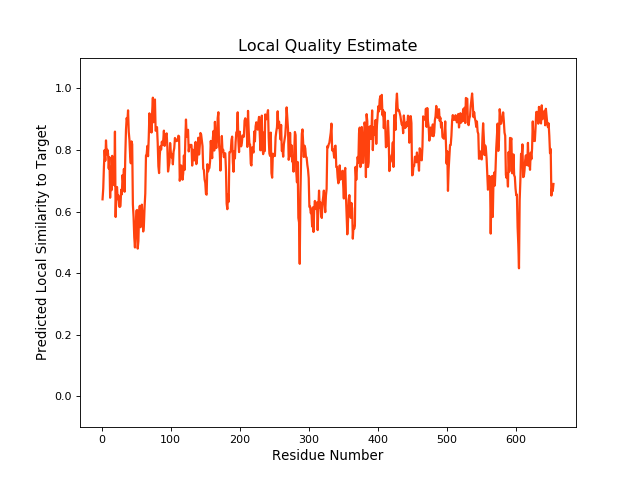
|
||||
| Click to Save Local Quality Plot in PNG Format | |||||
| QMEANBrane Score | 0.79 | ||||
| SNP ID | |||||
| Variation Type | Q/E | ||||
| Site of GPD | chr4:88131171 (GRCh38.p12) | ||||
| Allele(s) in dbSNP | G>C / G>T | ||||
| Minor Allele Frequency | T=0.1194/598 | ||||
| GPD Details | GPD Info | ||||
| Structure Details | |||||
| Modeling Method | Homology modeling | ||||
| Template PDB | 6ETI_A | Identity | 99.847% | ||
| Model Performance | Minimized Score | -1693.537 kcal/mol | |||
| Ramachandra Favored |
Excellent |
||||
| QMEANBrane Quality |
Medium |
||||
| Ramachandran Plot |
|
||||
| Click to Save Ramachandran Plot in PNG Format | |||||
| Ramz Z Score | -0.37 ± 0.32 | ||||
| Residues in Favored Region | 645 | Percentage of Favorable Residues | 98.77% | ||
| Number of Outliers | 0 | Ramachandran outliers | 0.00% | ||
| Local Quality |
|
||||
| Click to Save Local Quality Plot in PNG Format | |||||
| QMEANBrane Score | 0.79 | ||||
| PDB ID | Scanning Method | Resolution | Mutation Sites | Details | Ref |
| 6HBU | EM | 3.09 Å | E211Q | [1] | |
| Structure | |||||
| Expression System | Homo sapiens | ||||
| Corresponding chain | A/B | ||||
| Sequence Length | 1-655 | Mutation | Yes | ||
| 6HCO | EM | 3.58 Å | E211Q | [1] | |
| Structure | |||||
| Expression System | Homo sapiens,Mus musculus | ||||
| Corresponding chain | A/B | ||||
| Sequence Length | 2-655 | Mutation | Yes | ||
| 6HZM | EM | 3.09 Å | E211Q | [1] | |
| Structure | |||||
| Expression System | Homo sapiens | ||||
| Corresponding chain | A/B | ||||
| Sequence Length | 1-655 | Mutation | Yes | ||
| References | |||||
| 1 | Cryo-EM structures of a human ABCG2 mutant trapped in ATP-bound and substrate-bound states. Nature. 2018 Nov;563(7731):426-430. | ||||
If you find any error in data or bug in web service, please kindly report it to Dr. Yin and Dr. Li.