
Detail Information of Mutation-induced Spatial Variation
| General Information of Drug Transporter (DT) | |||||
|---|---|---|---|---|---|
| DT ID | DTD0014 Transporter Info | ||||
| Gene Name | ABCB11 | ||||
| Transporter Name | Bile salt export pump | ||||
| Gene ID | |||||
| UniProt ID | |||||
| Mutation-induced Spatial Variation (MSV) of This DT | |||||
| SNP ID | |||||
| Variation Type | V/D | ||||
| Site of GPD | chr2:168973818 (GRCh38.p12) | ||||
| Allele(s) in dbSNP | A>C / A>G / A>T | ||||
| Minor Allele Frequency | A=0.3892/1500 | ||||
| GPD Details | GPD Info | ||||
| Structure Details | |||||
| Modeling Method | Homology modeling | ||||
| Template PDB | 6LR0_U | Identity | 99.849% | ||
| Model Performance | Minimized Score | -2446.156 kcal/mol | |||
| Ramachandra Favored |
Medium |
||||
| QMEANBrane Quality |
Medium |
||||
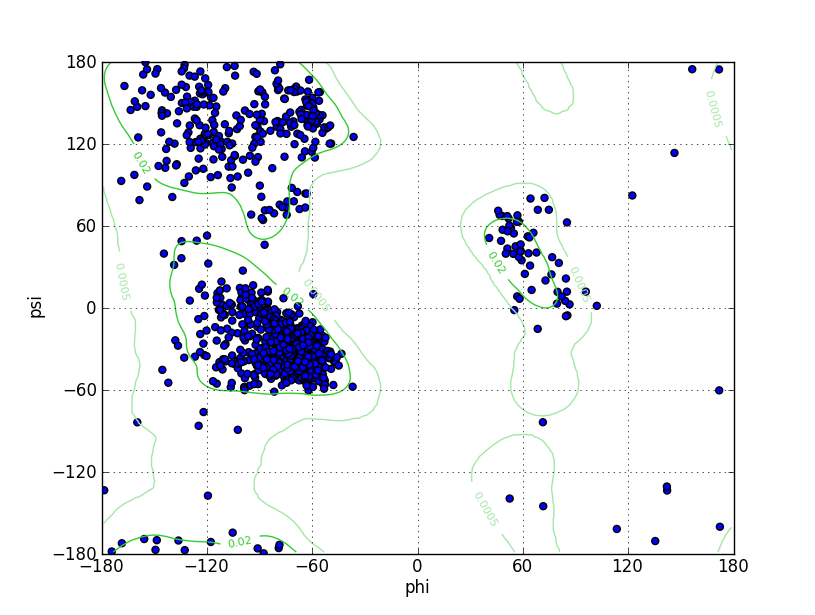
| Ramachandran Plot |
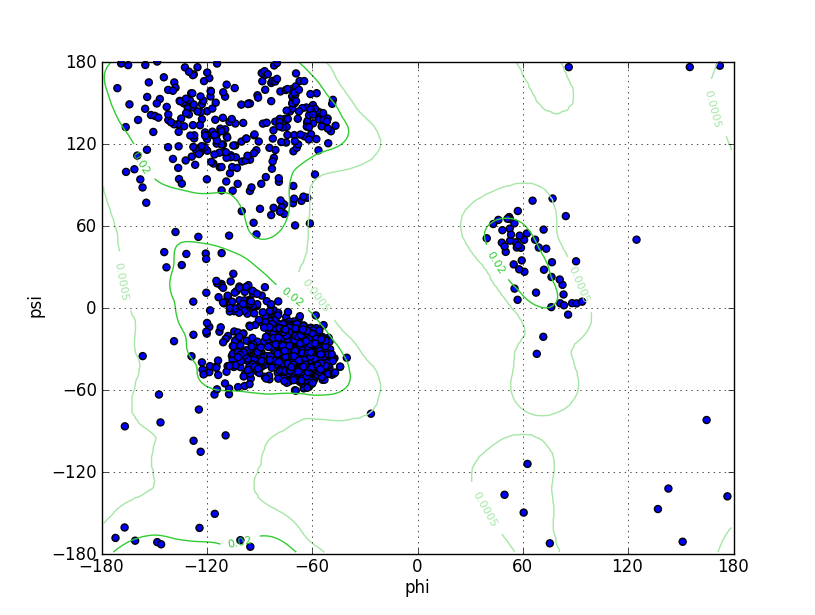
|
||||
| Click to Save Ramachandran Plot in PNG Format | |||||
| Ramz Z Score | -2.51 ± 0.21 | ||||
| Residues in Favored Region | 1257 | Percentage of Favorable Residues | 95.30% | ||
| Number of Outliers | 7 | Ramachandran outliers | 0.53% | ||
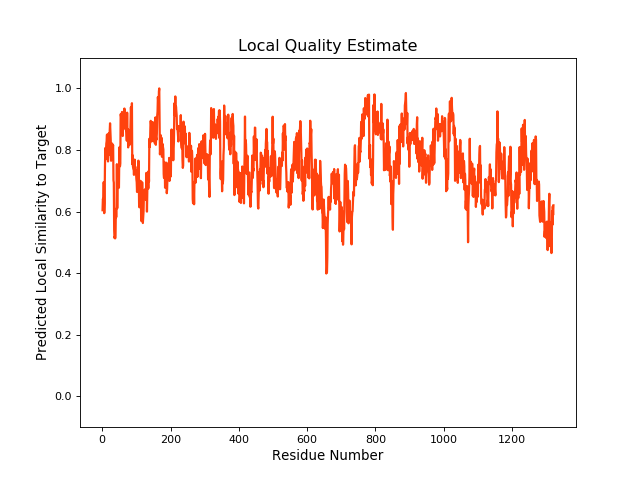
| Local Quality |
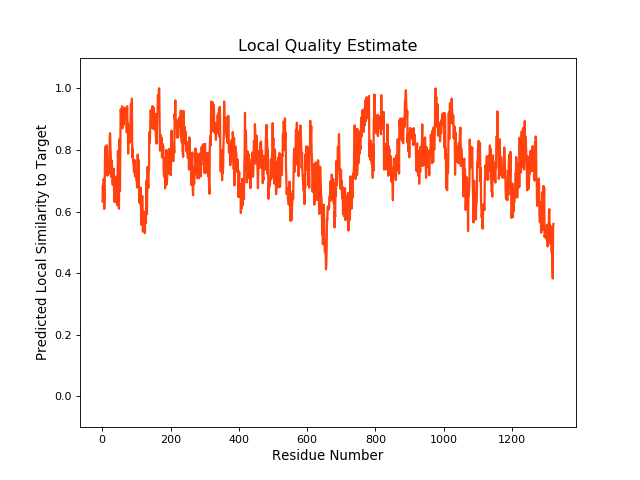
|
||||
| Click to Save Local Quality Plot in PNG Format | |||||
| QMEANBrane Score | 0.76 | ||||
| SNP ID | |||||
| Variation Type | V/G | ||||
| Site of GPD | chr2:168973818 (GRCh38.p12) | ||||
| Allele(s) in dbSNP | A>C / A>G / A>T | ||||
| Minor Allele Frequency | A=0.3892/1500 | ||||
| GPD Details | GPD Info | ||||
| Structure Details | |||||
| Modeling Method | Homology modeling | ||||
| Template PDB | 6LR0_U | Identity | 99.849% | ||
| Model Performance | Minimized Score | -2473.998 kcal/mol | |||
| Ramachandra Favored |
Medium |
||||
| QMEANBrane Quality |
Medium |
||||
| Ramachandran Plot |
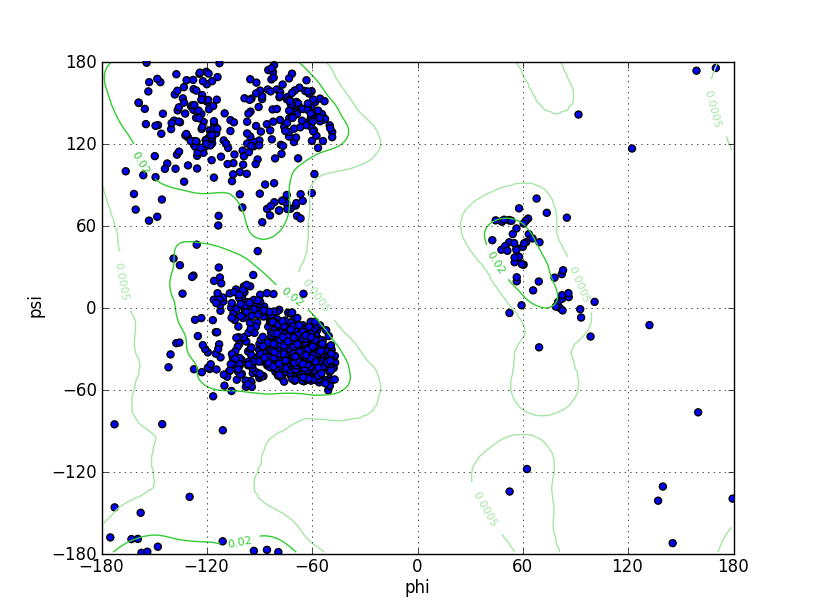
|
||||
| Click to Save Ramachandran Plot in PNG Format | |||||
| Ramz Z Score | -2.37 ± 0.21 | ||||
| Residues in Favored Region | 1268 | Percentage of Favorable Residues | 96.13% | ||
| Number of Outliers | 6 | Ramachandran outliers | 0.45% | ||
| Local Quality |
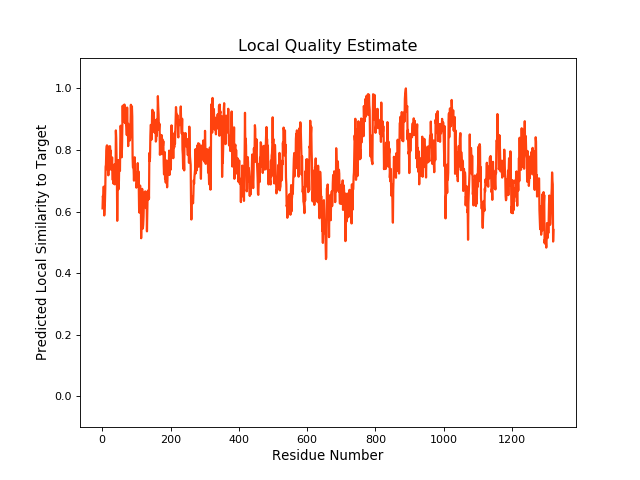
|
||||
| Click to Save Local Quality Plot in PNG Format | |||||
| QMEANBrane Score | 0.75 | ||||
| SNP ID | |||||
| Variation Type | V/A | ||||
| Site of GPD | chr2:168973818 (GRCh38.p12) | ||||
| Allele(s) in dbSNP | A>C / A>G / A>T | ||||
| Minor Allele Frequency | A=0.3892/1500 | ||||
| GPD Details | GPD Info | ||||
| Structure Details | |||||
| Modeling Method | Homology modeling | ||||
| Template PDB | 6LR0_U | Identity | 99.849% | ||
| Model Performance | Minimized Score | -2423.751 kcal/mol | |||
| Ramachandra Favored |
Medium |
||||
| QMEANBrane Quality |
Medium |
||||
| Ramachandran Plot |
|
||||
| Click to Save Ramachandran Plot in PNG Format | |||||
| Ramz Z Score | -2.85 ± 0.2 | ||||
| Residues in Favored Region | 1262 | Percentage of Favorable Residues | 95.68% | ||
| Number of Outliers | 9 | Ramachandran outliers | 0.68% | ||
| Local Quality |
|
||||
| Click to Save Local Quality Plot in PNG Format | |||||
| QMEANBrane Score | 0.75 | ||||
If you find any error in data or bug in web service, please kindly report it to Dr. Yin and Dr. Li.