
Detail Information of Mutation-induced Spatial Variation
| General Information of Drug Transporter (DT) | |||||
|---|---|---|---|---|---|
| DT ID | DTD0100 Transporter Info | ||||
| Gene Name | SLC16A1 | ||||
| Transporter Name | Monocarboxylate transporter 1 | ||||
| Gene ID | |||||
| UniProt ID | |||||
| Mutation-induced Spatial Variation (MSV) of This DT | |||||
| SNP ID | |||||
| Variation Type | D/E | ||||
| Site of GPD | chr1:112913924 (GRCh38.p12) | ||||
| Allele(s) in dbSNP | A>T | ||||
| Minor Allele Frequency | A=0.3233/1619 | ||||
| GPD Details | GPD Info | ||||
| Structure Details | |||||
| Modeling Method | Homology modeling | ||||
| Template PDB | 6LYY_A | Identity | 99.8% | ||
| Model Performance | Minimized Score | -1079.301 kcal/mol | |||
| Ramachandra Favored |
Medium |
||||
| QMEANBrane Quality |
Medium |
||||
| Ramachandran Plot |
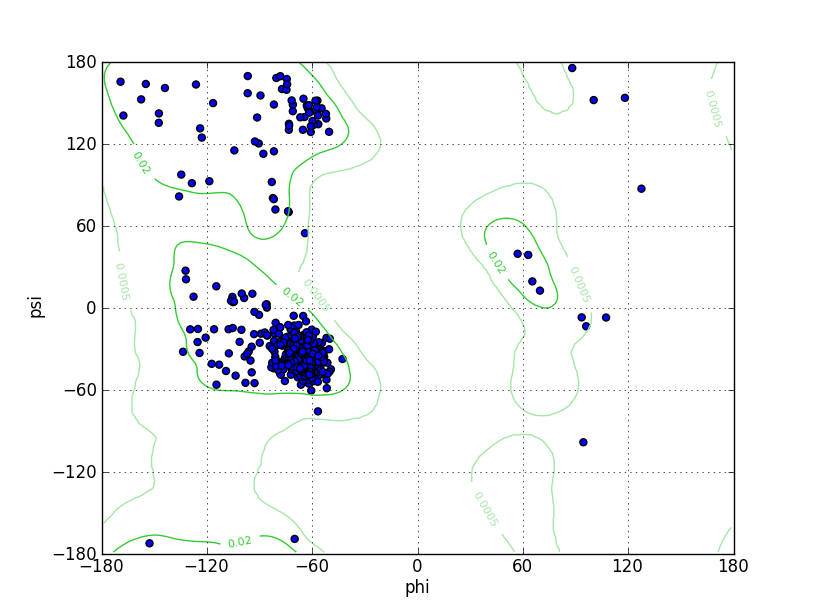
|
||||
| Click to Save Ramachandran Plot in PNG Format | |||||
| Ramz Z Score | -1.06 ± 0.35 | ||||
| Residues in Favored Region | 488 | Percentage of Favorable Residues | 97.99% | ||
| Number of Outliers | 2 | Ramachandran outliers | 0.40% | ||
| Local Quality |
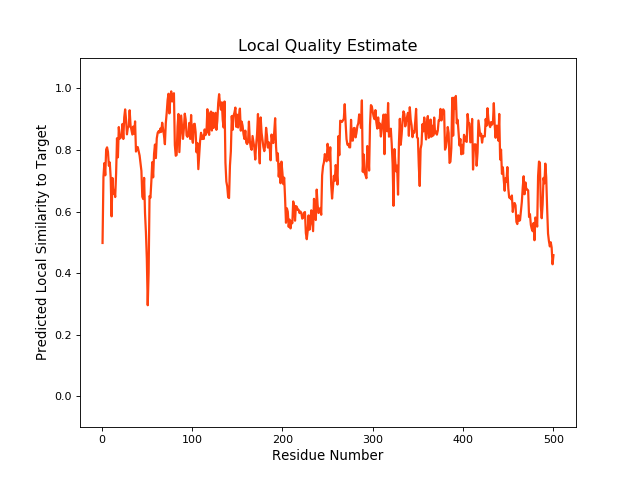
|
||||
| Click to Save Local Quality Plot in PNG Format | |||||
| QMEANBrane Score | 0.78 | ||||
| PDB ID | Scanning Method | Resolution | Mutation Sites | Details | Ref |
| 7DA5 | EM | 3.3 Å | D309N | [1] | |
| Structure | |||||
| Expression System | Homo sapiens | ||||
| Corresponding chain | A | ||||
| Sequence Length | 1-500 | Mutation | Yes | ||
| References | |||||
| 1 | Structural basis of human monocarboxylate transporter 1 inhibition by anti-cancer drug candidates. Cell. 2021 Jan 21;184(2):370-383.e13. | ||||
If you find any error in data or bug in web service, please kindly report it to Dr. Yin and Dr. Li.