Detail Information of Epigenetic Regulations
| General Information of Drug Transporter (DT) | |||||
|---|---|---|---|---|---|
| DT ID | DTD0020 Transporter Info | ||||
| Gene Name | SLC10A2 | ||||
| Transporter Name | Apical sodium-dependent bile acid transporter | ||||
| Gene ID | |||||
| UniProt ID | |||||
| Epigenetic Regulations of This DT (EGR) | |||||
|---|---|---|---|---|---|
|
Methylation |
|||||
|
Pancretic ductal adenocarcinoma |
3 Epigenetic Phenomena Related to This Phenotype | Click to Show/Hide the Full List | |||
|
Epigenetic Phenomenon 1 |
Methylation of SLC10A2 in pancretic ductal adenocarcinoma | [ 1 ] | |||
|
Location |
5'UTR (cg09543255) | ||||
|
Epigenetic Type |
Methylation | Experiment Method | Infinium HumanMethylation450 BeadChip | ||
|
Methylation Fold Change |
Fold Change: 2.01E+00 | Statistic Test | p-value: 3.98E-26; Z-score: 3.70E+00 | ||
|
Methylation in Case |
4.49E-01 (Median) | Methylation in Control | 2.23E-01 (Median) | ||
|
Studied Phenotype |
Pancretic ductal adenocarcinoma [ ICD-11: 2C10.0] | ||||
|
Experimental Material |
Patient tissue samples | ||||
|
Epigenetic Phenomenon 2 |
Methylation of SLC10A2 in pancretic ductal adenocarcinoma | [ 1 ] | |||
|
Location |
1stExon (cg06869796) | ||||
|
Epigenetic Type |
Methylation | Experiment Method | Infinium HumanMethylation450 BeadChip | ||
|
Methylation Fold Change |
Fold Change: 1.16E+00 | Statistic Test | p-value: 1.24E-06; Z-score: 1.62E+00 | ||
|
Methylation in Case |
7.90E-01 (Median) | Methylation in Control | 6.79E-01 (Median) | ||
|
Studied Phenotype |
Pancretic ductal adenocarcinoma [ ICD-11: 2C10.0] | ||||
|
Experimental Material |
Patient tissue samples | ||||
|
Epigenetic Phenomenon 3 |
Methylation of SLC10A2 in pancretic ductal adenocarcinoma | [ 1 ] | |||
|
Location |
Body (cg24642933) | ||||
|
Epigenetic Type |
Methylation | Experiment Method | Infinium HumanMethylation450 BeadChip | ||
|
Methylation Fold Change |
Fold Change: -1.10E+00 | Statistic Test | p-value: 6.30E-06; Z-score: -1.19E+00 | ||
|
Methylation in Case |
6.20E-01 (Median) | Methylation in Control | 6.84E-01 (Median) | ||
|
Studied Phenotype |
Pancretic ductal adenocarcinoma [ ICD-11: 2C10.0] | ||||
|
Experimental Material |
Patient tissue samples | ||||
|
Breast cancer |
4 Epigenetic Phenomena Related to This Phenotype | Click to Show/Hide the Full List | |||
|
Epigenetic Phenomenon 1 |
Methylation of SLC10A2 in breast cancer | [ 2 ] | |||
|
Location |
TSS1500 (cg14479139) | ||||
|
Epigenetic Type |
Methylation | Experiment Method | Infinium HumanMethylation450 BeadChip | ||
|
Methylation Fold Change |
Fold Change: -1.17E+00 | Statistic Test | p-value: 1.13E-07; Z-score: -1.40E+00 | ||
|
Methylation in Case |
5.76E-01 (Median) | Methylation in Control | 6.73E-01 (Median) | ||
|
Studied Phenotype |
Breast cancer [ ICD-11: 2C60-2C6Z] | ||||
|
Experimental Material |
Patient tissue samples | ||||
|
Epigenetic Phenomenon 2 |
Methylation of SLC10A2 in breast cancer | [ 2 ] | |||
|
Location |
TSS1500 (cg09125550) | ||||
|
Epigenetic Type |
Methylation | Experiment Method | Infinium HumanMethylation450 BeadChip | ||
|
Methylation Fold Change |
Fold Change: -1.03E+00 | Statistic Test | p-value: 1.41E-04; Z-score: -6.67E-01 | ||
|
Methylation in Case |
8.61E-01 (Median) | Methylation in Control | 8.90E-01 (Median) | ||
|
Studied Phenotype |
Breast cancer [ ICD-11: 2C60-2C6Z] | ||||
|
Experimental Material |
Patient tissue samples | ||||
|
Epigenetic Phenomenon 3 |
Methylation of SLC10A2 in breast cancer | [ 2 ] | |||
|
Location |
TSS1500 (cg22971191) | ||||
|
Epigenetic Type |
Methylation | Experiment Method | Infinium HumanMethylation450 BeadChip | ||
|
Methylation Fold Change |
Fold Change: -1.09E+00 | Statistic Test | p-value: 2.75E-04; Z-score: -8.58E-01 | ||
|
Methylation in Case |
6.50E-01 (Median) | Methylation in Control | 7.08E-01 (Median) | ||
|
Studied Phenotype |
Breast cancer [ ICD-11: 2C60-2C6Z] | ||||
|
Experimental Material |
Patient tissue samples | ||||
|
Epigenetic Phenomenon 4 |
Methylation of SLC10A2 in breast cancer | [ 2 ] | |||
|
Location |
Body (cg08450807) | ||||
|
Epigenetic Type |
Methylation | Experiment Method | Infinium HumanMethylation450 BeadChip | ||
|
Methylation Fold Change |
Fold Change: -1.19E+00 | Statistic Test | p-value: 1.16E-14; Z-score: -2.88E+00 | ||
|
Methylation in Case |
6.53E-01 (Median) | Methylation in Control | 7.75E-01 (Median) | ||
|
Studied Phenotype |
Breast cancer [ ICD-11: 2C60-2C6Z] | ||||
|
Experimental Material |
Patient tissue samples | ||||
|
Colorectal cancer |
3 Epigenetic Phenomena Related to This Phenotype | Click to Show/Hide the Full List | |||
|
Epigenetic Phenomenon 1 |
Methylation of SLC10A2 in colorectal cancer | [ 3 ] | |||
|
Location |
TSS1500 (cg22971191) | ||||
|
Epigenetic Type |
Methylation | Experiment Method | Infinium HumanMethylation450 BeadChip | ||
|
Methylation Fold Change |
Fold Change: -1.11E+00 | Statistic Test | p-value: 1.04E-07; Z-score: -1.86E+00 | ||
|
Methylation in Case |
7.71E-01 (Median) | Methylation in Control | 8.58E-01 (Median) | ||
|
Studied Phenotype |
Colorectal cancer [ ICD-11: 2B91] | ||||
|
Experimental Material |
Patient tissue samples | ||||
|
Epigenetic Phenomenon 2 |
Methylation of SLC10A2 in colorectal cancer | [ 3 ] | |||
|
Location |
TSS1500 (cg14479139) | ||||
|
Epigenetic Type |
Methylation | Experiment Method | Infinium HumanMethylation450 BeadChip | ||
|
Methylation Fold Change |
Fold Change: -1.09E+00 | Statistic Test | p-value: 3.74E-02; Z-score: -4.09E-01 | ||
|
Methylation in Case |
8.06E-01 (Median) | Methylation in Control | 8.80E-01 (Median) | ||
|
Studied Phenotype |
Colorectal cancer [ ICD-11: 2B91] | ||||
|
Experimental Material |
Patient tissue samples | ||||
|
Epigenetic Phenomenon 3 |
Methylation of SLC10A2 in colorectal cancer | [ 3 ] | |||
|
Location |
Body (cg08450807) | ||||
|
Epigenetic Type |
Methylation | Experiment Method | Infinium HumanMethylation450 BeadChip | ||
|
Methylation Fold Change |
Fold Change: -1.37E+00 | Statistic Test | p-value: 9.73E-19; Z-score: -1.09E+01 | ||
|
Methylation in Case |
6.60E-01 (Median) | Methylation in Control | 9.01E-01 (Median) | ||
|
Studied Phenotype |
Colorectal cancer [ ICD-11: 2B91] | ||||
|
Experimental Material |
Patient tissue samples | ||||
|
Depression |
1 Epigenetic Phenomena Related to This Phenotype | Click to Show/Hide the Full List | |||
|
Epigenetic Phenomenon 1 |
Methylation of SLC10A2 in depression | [ 4 ] | |||
|
Location |
TSS1500 (cg14479139) | ||||
|
Epigenetic Type |
Methylation | Experiment Method | Infinium HumanMethylation450 BeadChip | ||
|
Methylation Fold Change |
Fold Change: 1.02E+00 | Statistic Test | p-value: 1.09E-02; Z-score: 4.56E-01 | ||
|
Methylation in Case |
7.38E-01 (Median) | Methylation in Control | 7.22E-01 (Median) | ||
|
Studied Phenotype |
Depression [ ICD-11: 6A8Z] | ||||
|
Experimental Material |
Patient tissue samples | ||||
|
Hepatocellular carcinoma |
2 Epigenetic Phenomena Related to This Phenotype | Click to Show/Hide the Full List | |||
|
Epigenetic Phenomenon 1 |
Methylation of SLC10A2 in hepatocellular carcinoma | [ 5 ] | |||
|
Location |
TSS1500 (cg09125550) | ||||
|
Epigenetic Type |
Methylation | Experiment Method | Infinium HumanMethylation450 BeadChip | ||
|
Methylation Fold Change |
Fold Change: -1.04E+00 | Statistic Test | p-value: 3.00E-06; Z-score: -1.09E+00 | ||
|
Methylation in Case |
8.51E-01 (Median) | Methylation in Control | 8.83E-01 (Median) | ||
|
Studied Phenotype |
Hepatocellular carcinoma [ ICD-11: 2C12.02] | ||||
|
Experimental Material |
Patient tissue samples | ||||
|
Epigenetic Phenomenon 2 |
Methylation of SLC10A2 in hepatocellular carcinoma | [ 5 ] | |||
|
Location |
Body (cg19378330) | ||||
|
Epigenetic Type |
Methylation | Experiment Method | Infinium HumanMethylation450 BeadChip | ||
|
Methylation Fold Change |
Fold Change: 1.44E+00 | Statistic Test | p-value: 2.00E-10; Z-score: 1.73E+00 | ||
|
Methylation in Case |
6.07E-01 (Median) | Methylation in Control | 4.23E-01 (Median) | ||
|
Studied Phenotype |
Hepatocellular carcinoma [ ICD-11: 2C12.02] | ||||
|
Experimental Material |
Patient tissue samples | ||||
|
Lung adenocarcinoma |
1 Epigenetic Phenomena Related to This Phenotype | Click to Show/Hide the Full List | |||
|
Epigenetic Phenomenon 1 |
Methylation of SLC10A2 in lung adenocarcinoma | [ 6 ] | |||
|
Location |
TSS1500 (cg14479139) | ||||
|
Epigenetic Type |
Methylation | Experiment Method | Infinium HumanMethylation450 BeadChip | ||
|
Methylation Fold Change |
Fold Change: -1.08E+00 | Statistic Test | p-value: 3.98E-02; Z-score: -2.21E+00 | ||
|
Methylation in Case |
6.87E-01 (Median) | Methylation in Control | 7.44E-01 (Median) | ||
|
Studied Phenotype |
Lung adenocarcinoma [ ICD-11: 2C25.0] | ||||
|
Experimental Material |
Patient tissue samples | ||||
|
Papillary thyroid cancer |
2 Epigenetic Phenomena Related to This Phenotype | Click to Show/Hide the Full List | |||
|
Epigenetic Phenomenon 1 |
Methylation of SLC10A2 in papillary thyroid cancer | [ 7 ] | |||
|
Location |
TSS1500 (cg14479139) | ||||
|
Epigenetic Type |
Methylation | Experiment Method | Infinium HumanMethylation450 BeadChip | ||
|
Methylation Fold Change |
Fold Change: -1.06E+00 | Statistic Test | p-value: 3.58E-05; Z-score: -9.68E-01 | ||
|
Methylation in Case |
7.34E-01 (Median) | Methylation in Control | 7.75E-01 (Median) | ||
|
Studied Phenotype |
Papillary thyroid cancer [ ICD-11: 2D10.1] | ||||
|
Experimental Material |
Patient tissue samples | ||||
|
Epigenetic Phenomenon 2 |
Methylation of SLC10A2 in papillary thyroid cancer | [ 7 ] | |||
|
Location |
Body (cg08450807) | ||||
|
Epigenetic Type |
Methylation | Experiment Method | Infinium HumanMethylation450 BeadChip | ||
|
Methylation Fold Change |
Fold Change: -1.07E+00 | Statistic Test | p-value: 4.29E-11; Z-score: -1.93E+00 | ||
|
Methylation in Case |
8.45E-01 (Median) | Methylation in Control | 9.04E-01 (Median) | ||
|
Studied Phenotype |
Papillary thyroid cancer [ ICD-11: 2D10.1] | ||||
|
Experimental Material |
Patient tissue samples | ||||
|
Prostate cancer |
2 Epigenetic Phenomena Related to This Phenotype | Click to Show/Hide the Full List | |||
|
Epigenetic Phenomenon 1 |
Methylation of SLC10A2 in prostate cancer | [ 8 ] | |||
|
Location |
TSS200 (cg16843423) | ||||
|
Epigenetic Type |
Methylation | Experiment Method | Infinium HumanMethylation450 BeadChip | ||
|
Methylation Fold Change |
Fold Change: 4.14E+00 | Statistic Test | p-value: 9.17E-03; Z-score: 9.87E+00 | ||
|
Methylation in Case |
1.90E-01 (Median) | Methylation in Control | 4.59E-02 (Median) | ||
|
Studied Phenotype |
Prostate cancer [ ICD-11: 2C82] | ||||
|
Experimental Material |
Patient tissue samples | ||||
|
Atypical teratoid rhabdoid tumor |
1 Epigenetic Phenomena Related to This Phenotype | Click to Show/Hide the Full List | |||
|
Epigenetic Phenomenon 1 |
Methylation of SLC10A2 in atypical teratoid rhabdoid tumor | [ 9 ] | |||
|
Location |
Body (cg08450807) | ||||
|
Epigenetic Type |
Methylation | Experiment Method | Infinium HumanMethylation450 BeadChip | ||
|
Methylation Fold Change |
Fold Change: 1.05E+00 | Statistic Test | p-value: 6.57E-03; Z-score: 5.97E-01 | ||
|
Methylation in Case |
8.69E-01 (Median) | Methylation in Control | 8.25E-01 (Median) | ||
|
Studied Phenotype |
Atypical teratoid rhabdoid tumor [ ICD-11: 2A00.1Y] | ||||
|
Experimental Material |
Patient tissue samples | ||||
|
Bladder cancer |
1 Epigenetic Phenomena Related to This Phenotype | Click to Show/Hide the Full List | |||
|
Epigenetic Phenomenon 1 |
Methylation of SLC10A2 in bladder cancer | [ 10 ] | |||
|
Location |
Body (cg08450807) | ||||
|
Epigenetic Type |
Methylation | Experiment Method | Infinium HumanMethylation450 BeadChip | ||
|
Methylation Fold Change |
Fold Change: -1.15E+00 | Statistic Test | p-value: 7.88E-05; Z-score: -4.98E+00 | ||
|
Methylation in Case |
7.21E-01 (Median) | Methylation in Control | 8.29E-01 (Median) | ||
|
Studied Phenotype |
Bladder cancer [ ICD-11: 2C94] | ||||
|
Experimental Material |
Patient tissue samples | ||||
|
HIV infection |
1 Epigenetic Phenomena Related to This Phenotype | Click to Show/Hide the Full List | |||
|
Epigenetic Phenomenon 1 |
Methylation of SLC10A2 in HIV infection | [ 11 ] | |||
|
Location |
Body (cg08450807) | ||||
|
Epigenetic Type |
Methylation | Experiment Method | Infinium HumanMethylation450 BeadChip | ||
|
Methylation Fold Change |
Fold Change: -1.09E+00 | Statistic Test | p-value: 2.03E-05; Z-score: -2.26E+00 | ||
|
Methylation in Case |
7.67E-01 (Median) | Methylation in Control | 8.34E-01 (Median) | ||
|
Studied Phenotype |
HIV infection [ ICD-11: 1C62.Z] | ||||
|
Experimental Material |
Patient tissue samples | ||||
|
Panic disorder |
1 Epigenetic Phenomena Related to This Phenotype | Click to Show/Hide the Full List | |||
|
Epigenetic Phenomenon 1 |
Methylation of SLC10A2 in panic disorder | [ 12 ] | |||
|
Location |
Body (cg08450807) | ||||
|
Epigenetic Type |
Methylation | Experiment Method | Infinium HumanMethylation450 BeadChip | ||
|
Methylation Fold Change |
Fold Change: 1.04E+00 | Statistic Test | p-value: 3.88E-02; Z-score: 2.35E-01 | ||
|
Methylation in Case |
2.81E+00 (Median) | Methylation in Control | 2.71E+00 (Median) | ||
|
Studied Phenotype |
Panic disorder [ ICD-11: 6B01] | ||||
|
Experimental Material |
Patient tissue samples | ||||
|
Liver cancer |
1 Epigenetic Phenomena Related to This Phenotype | Click to Show/Hide the Full List | |||
|
Epigenetic Phenomenon 1 |
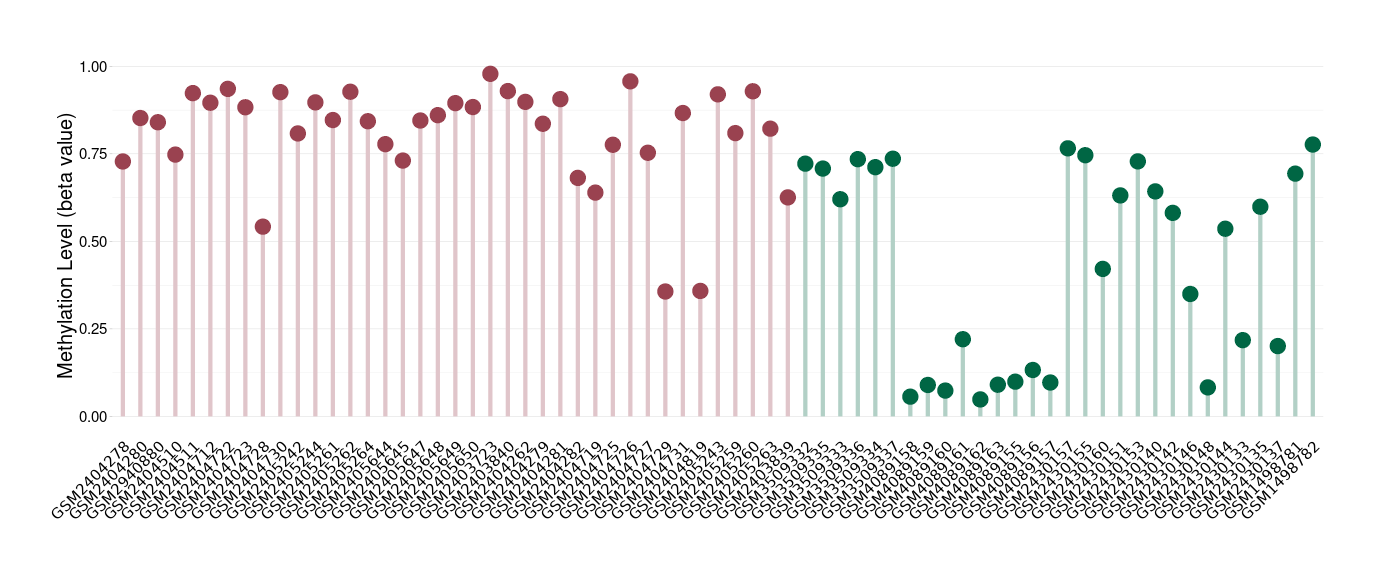
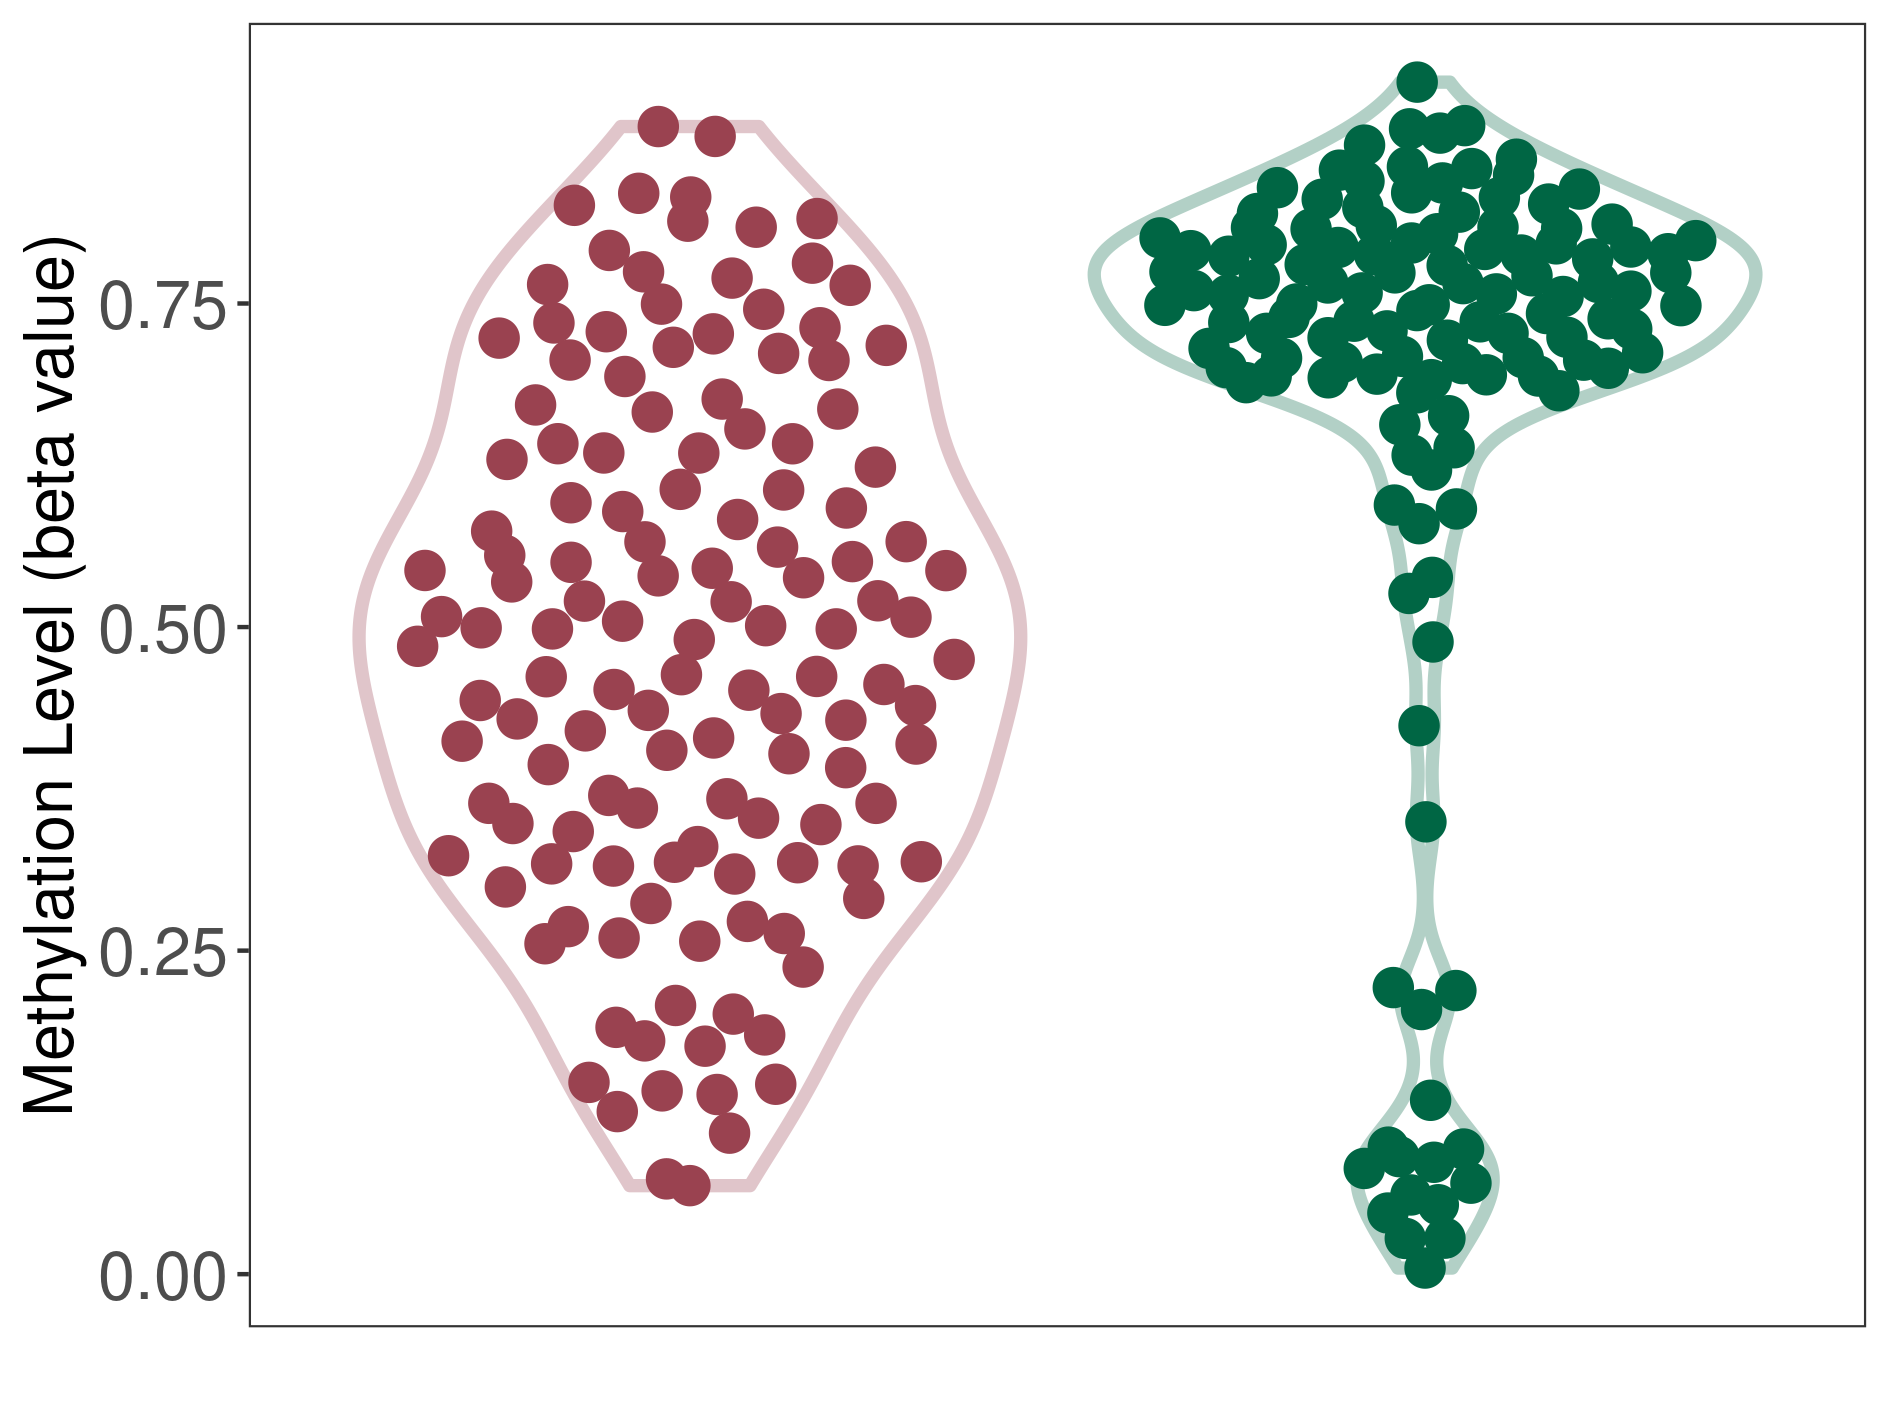
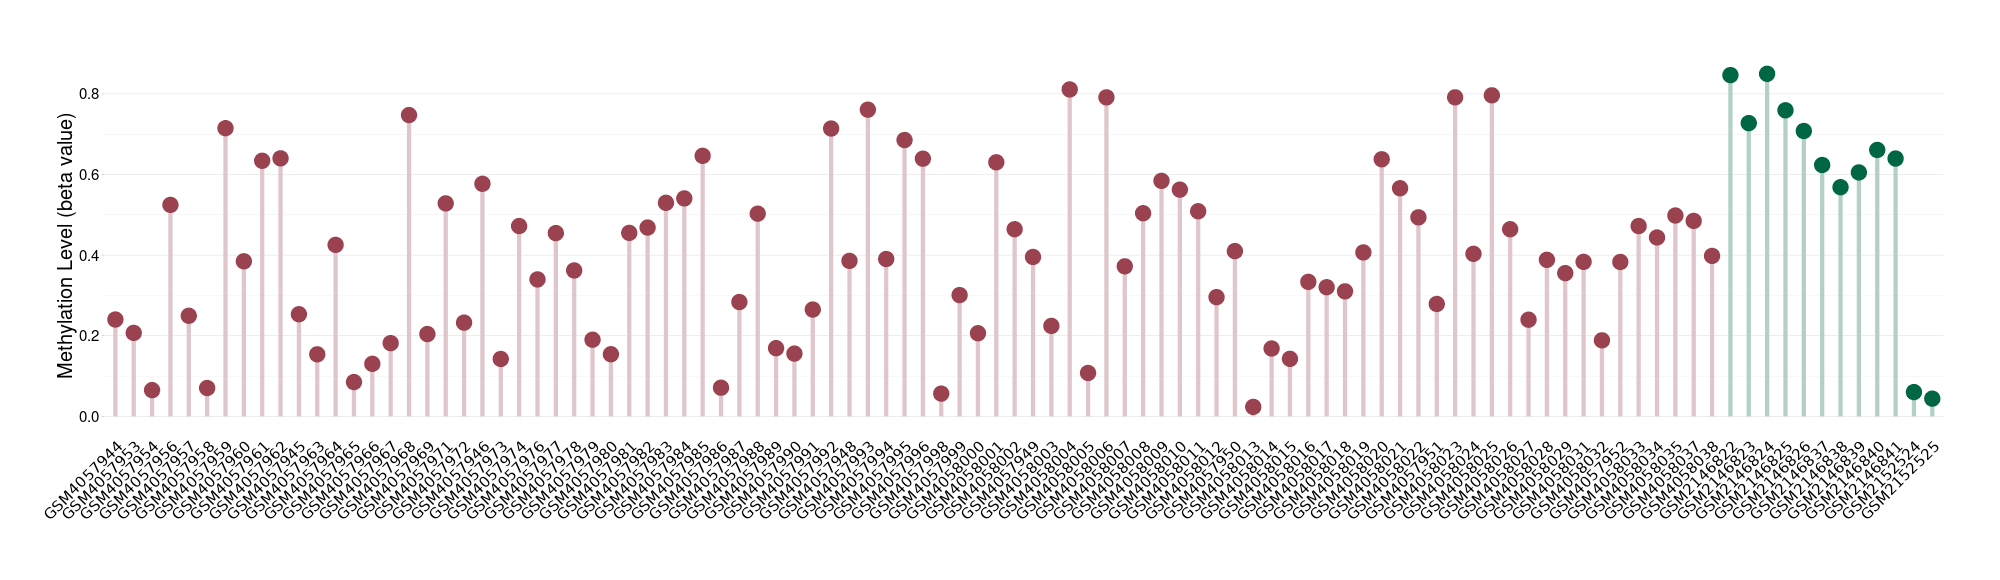
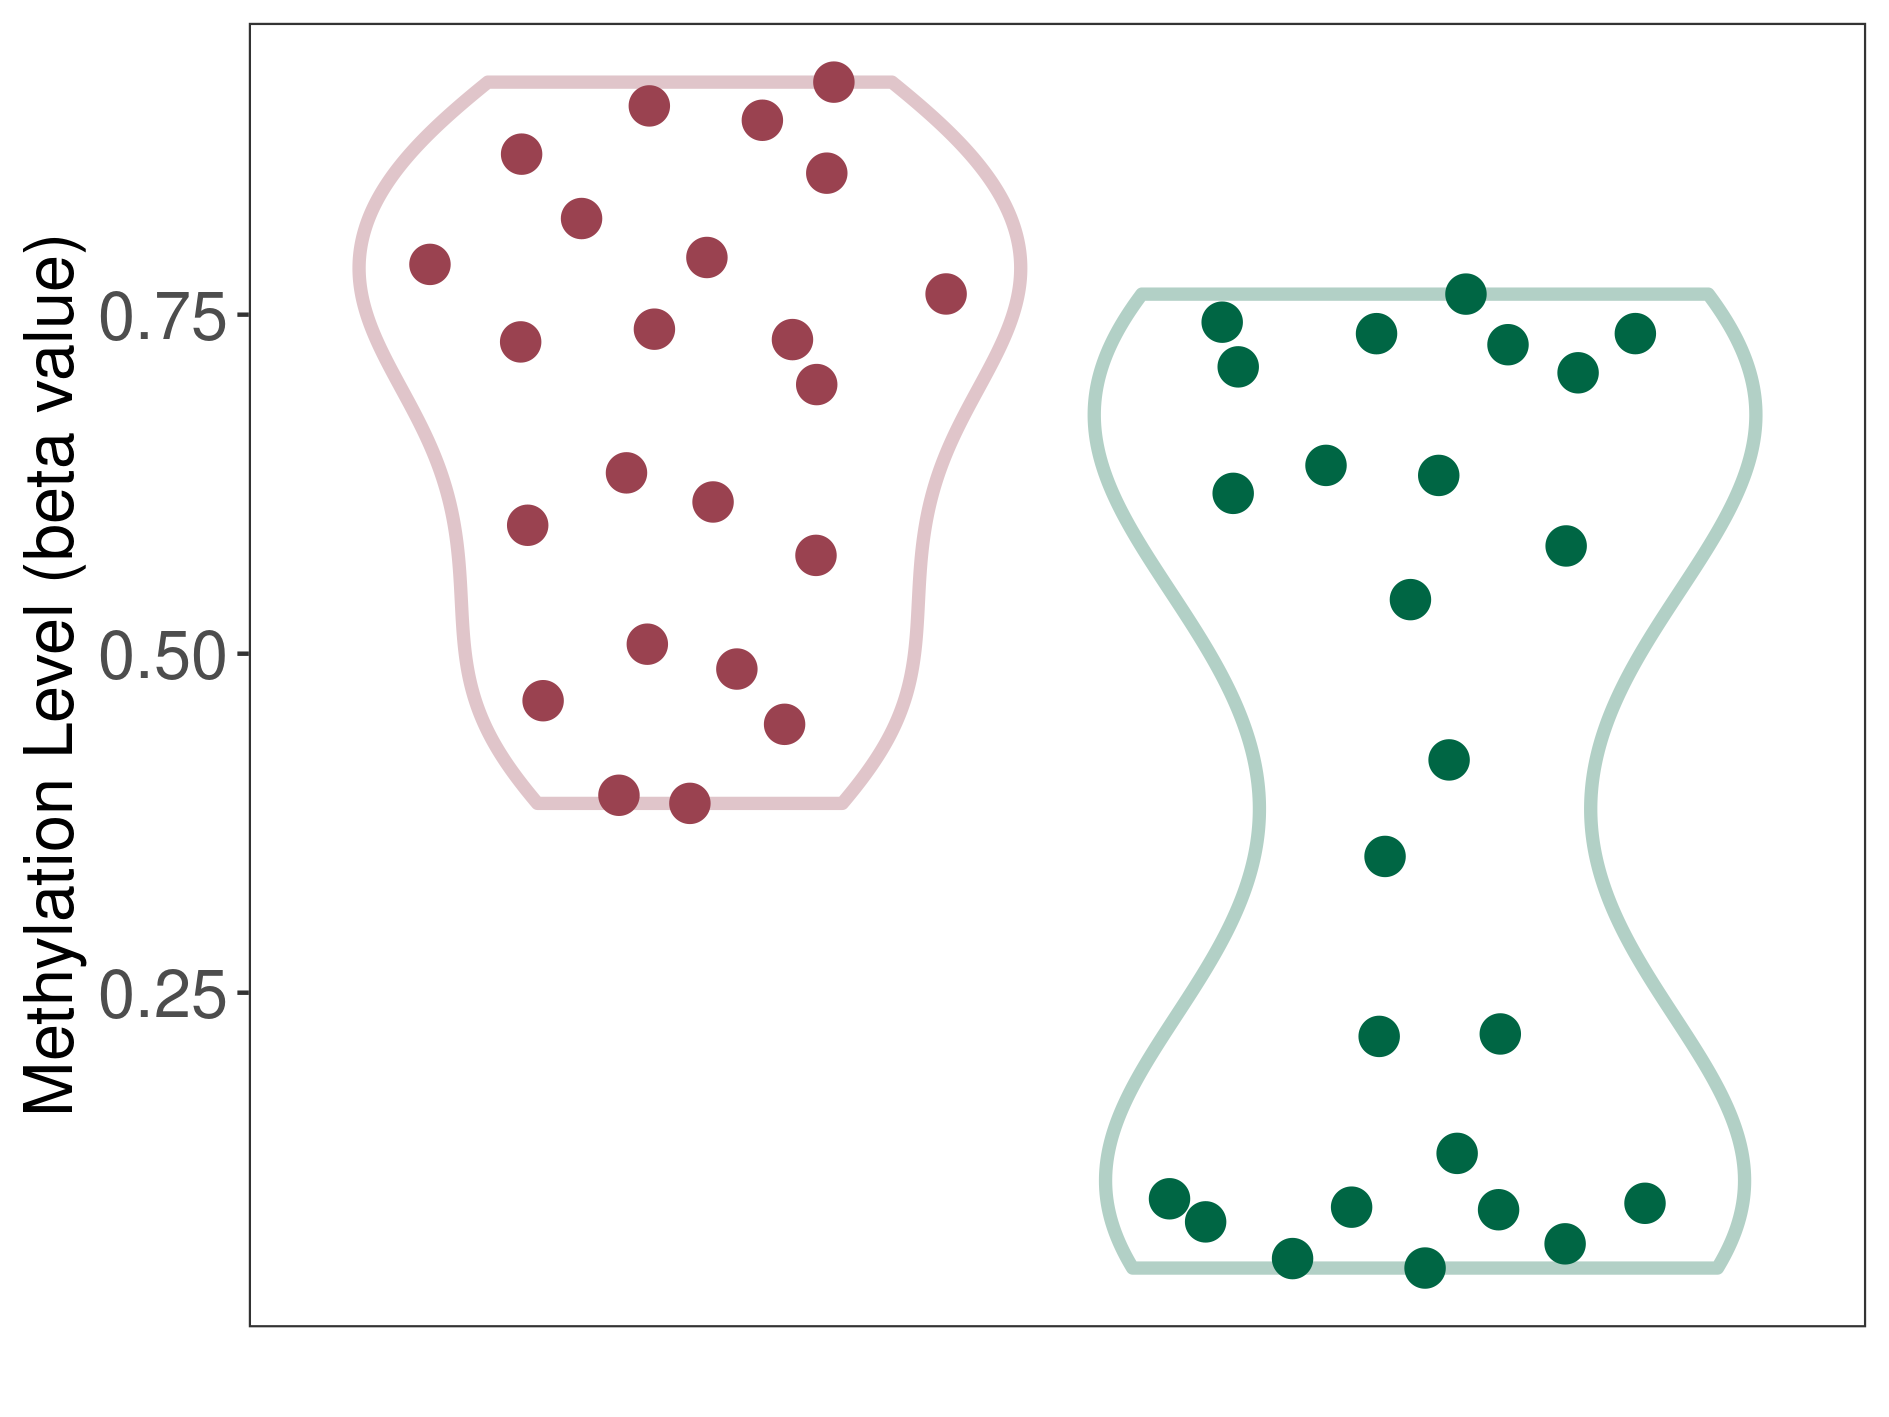
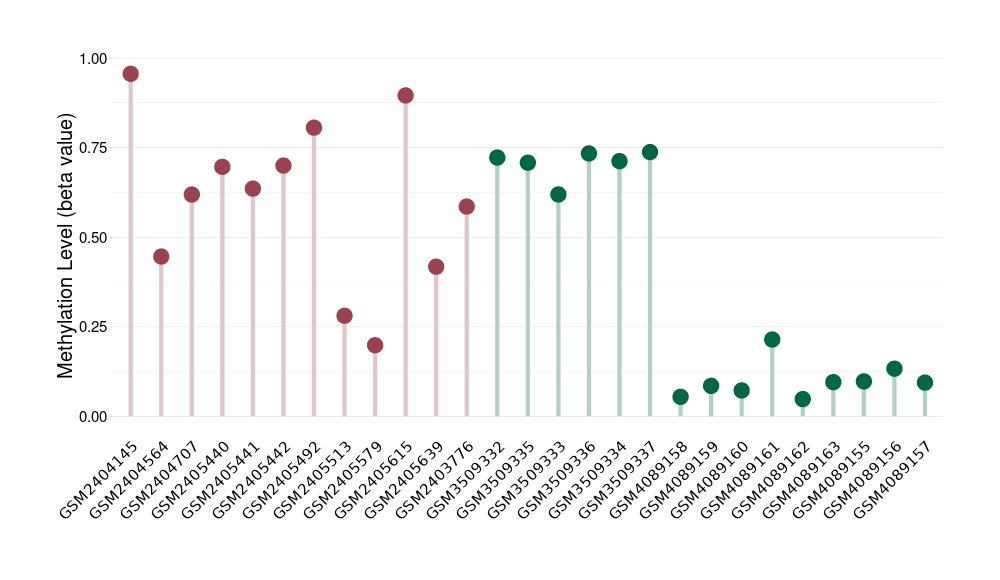
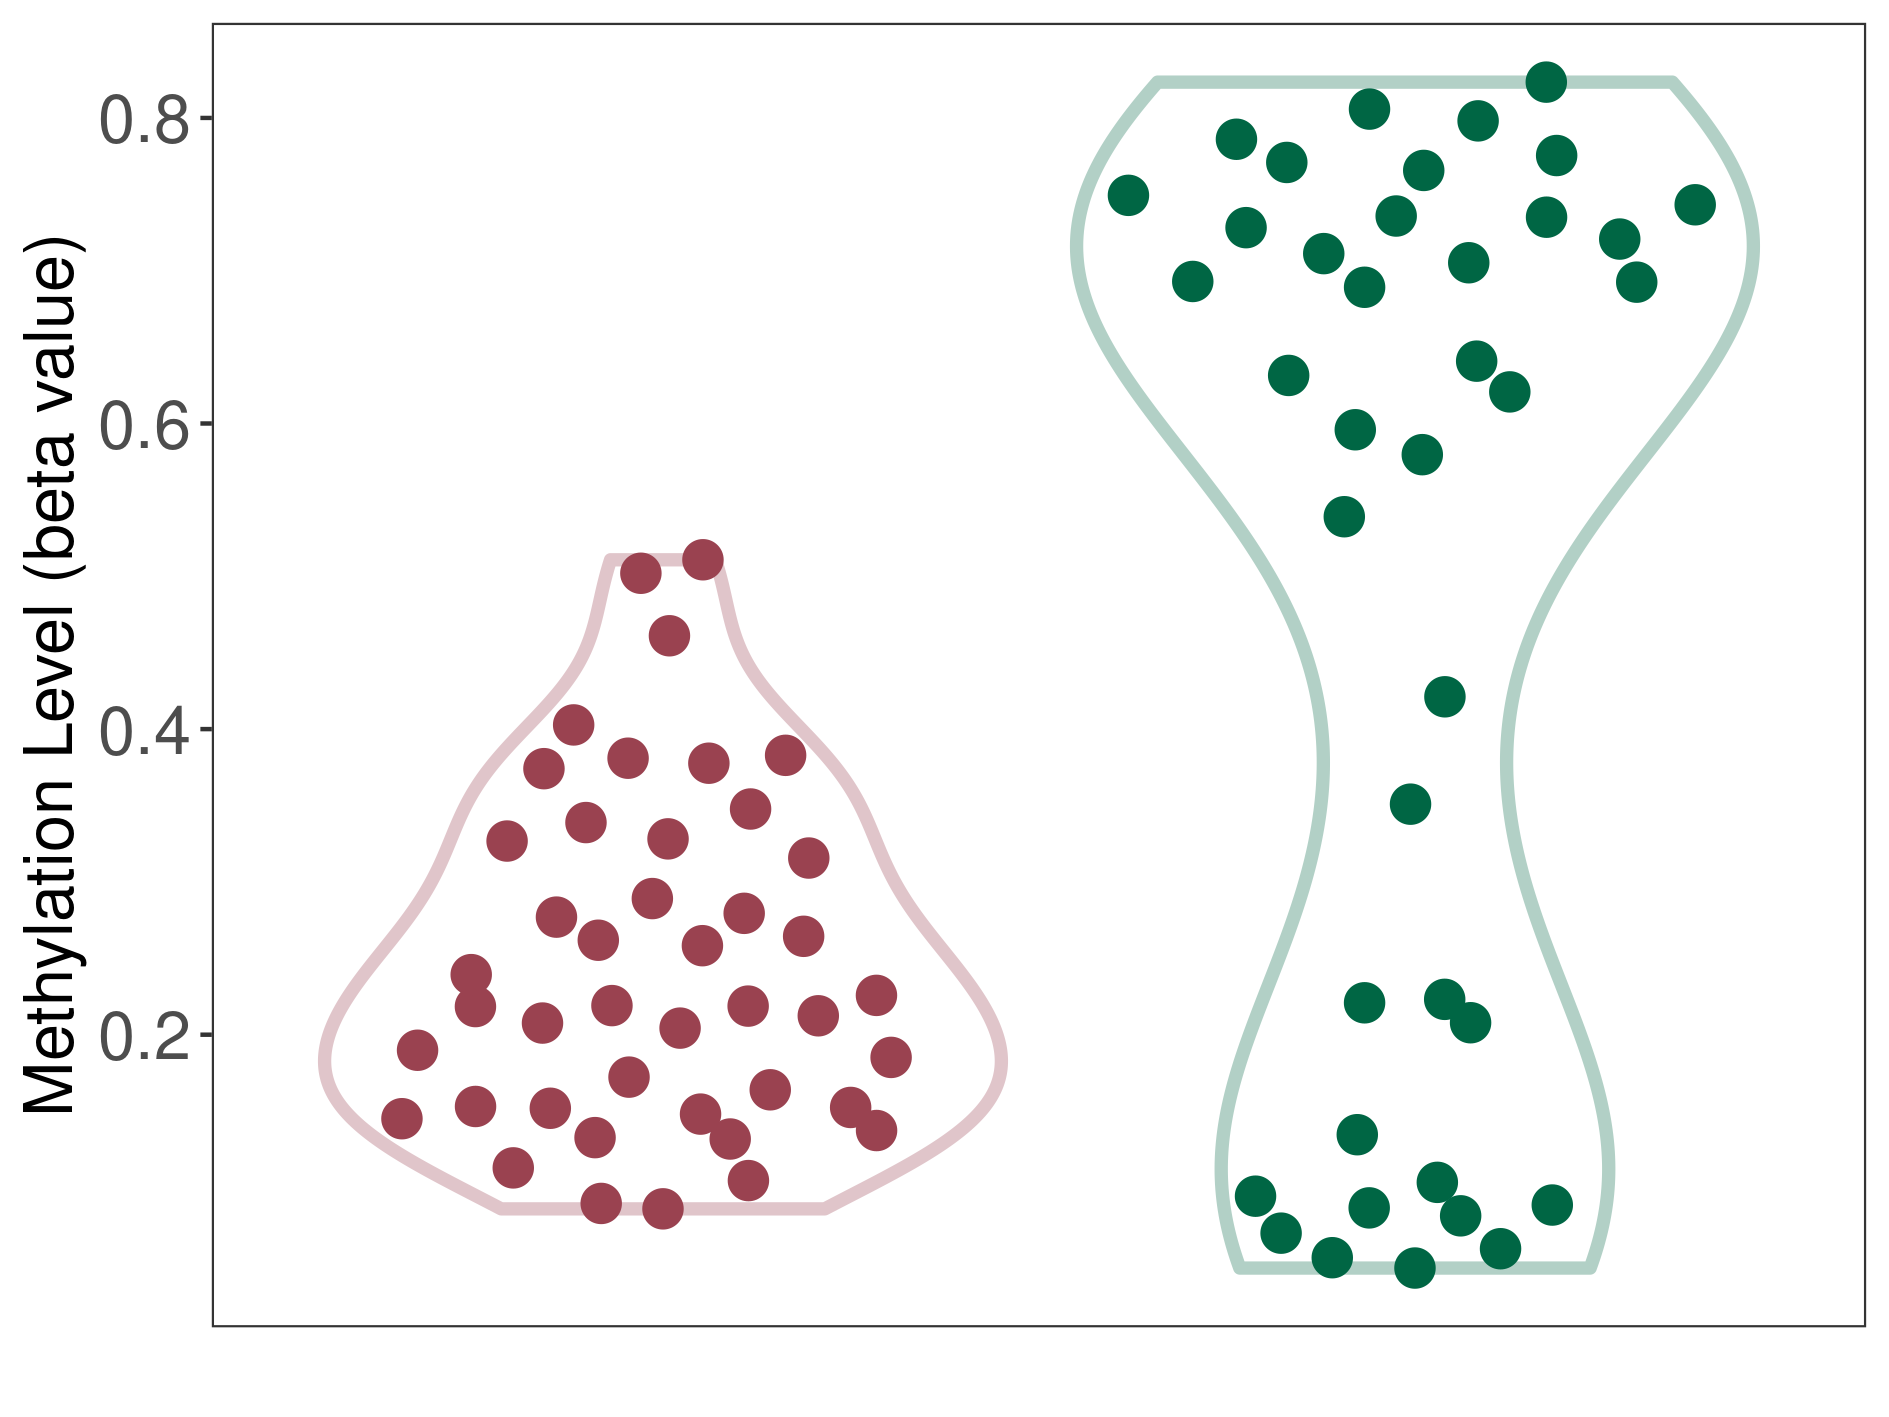
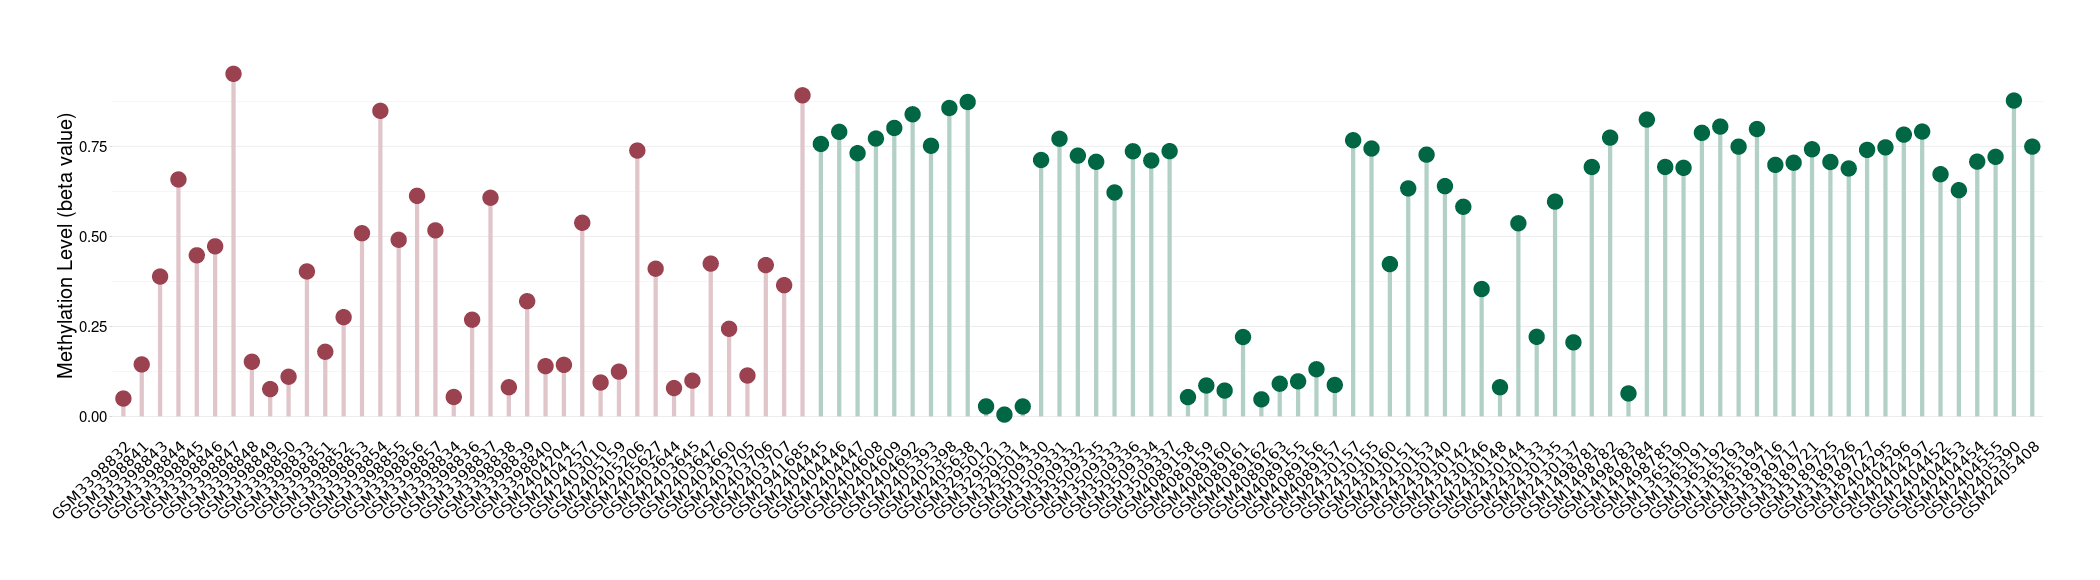
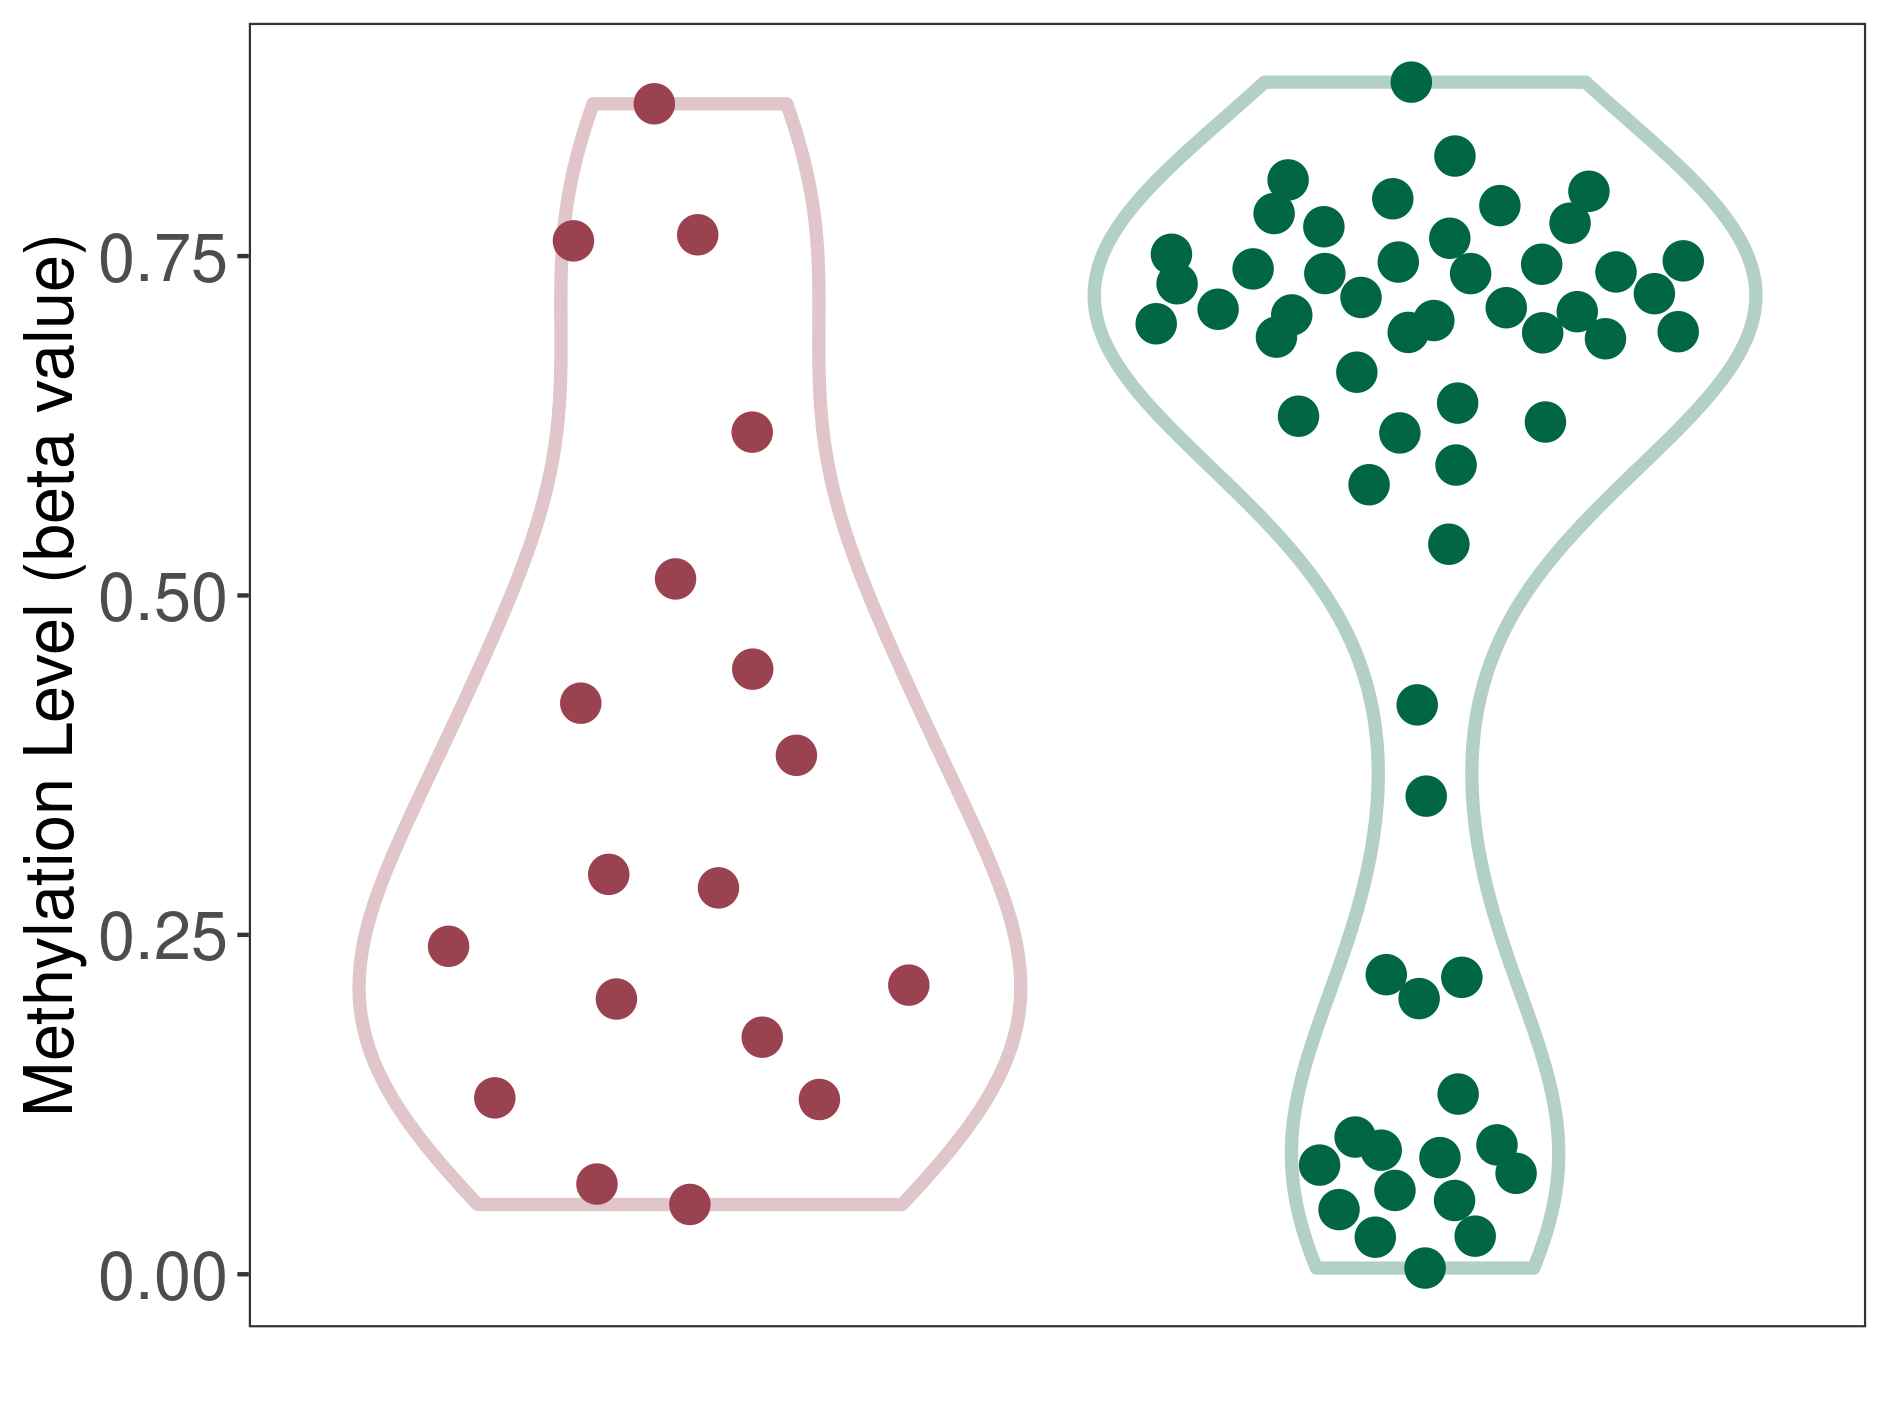
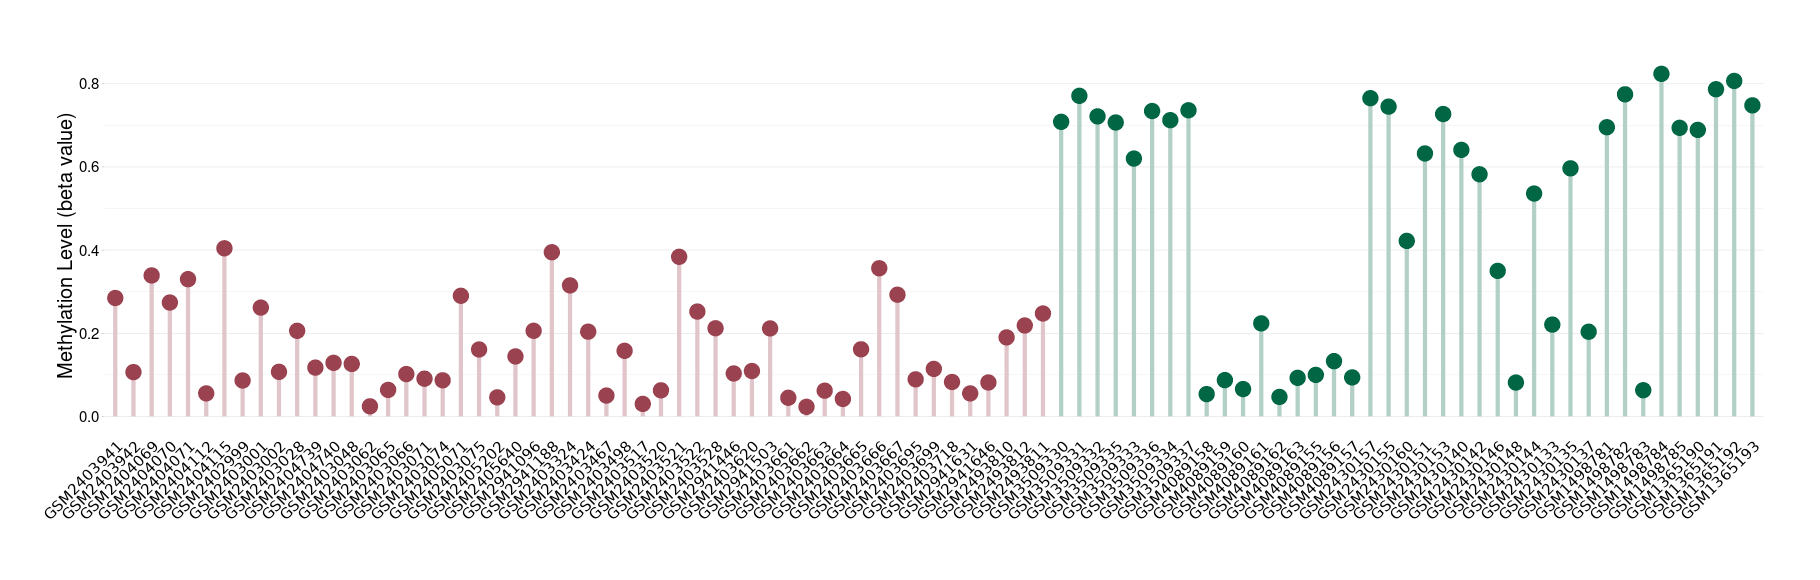
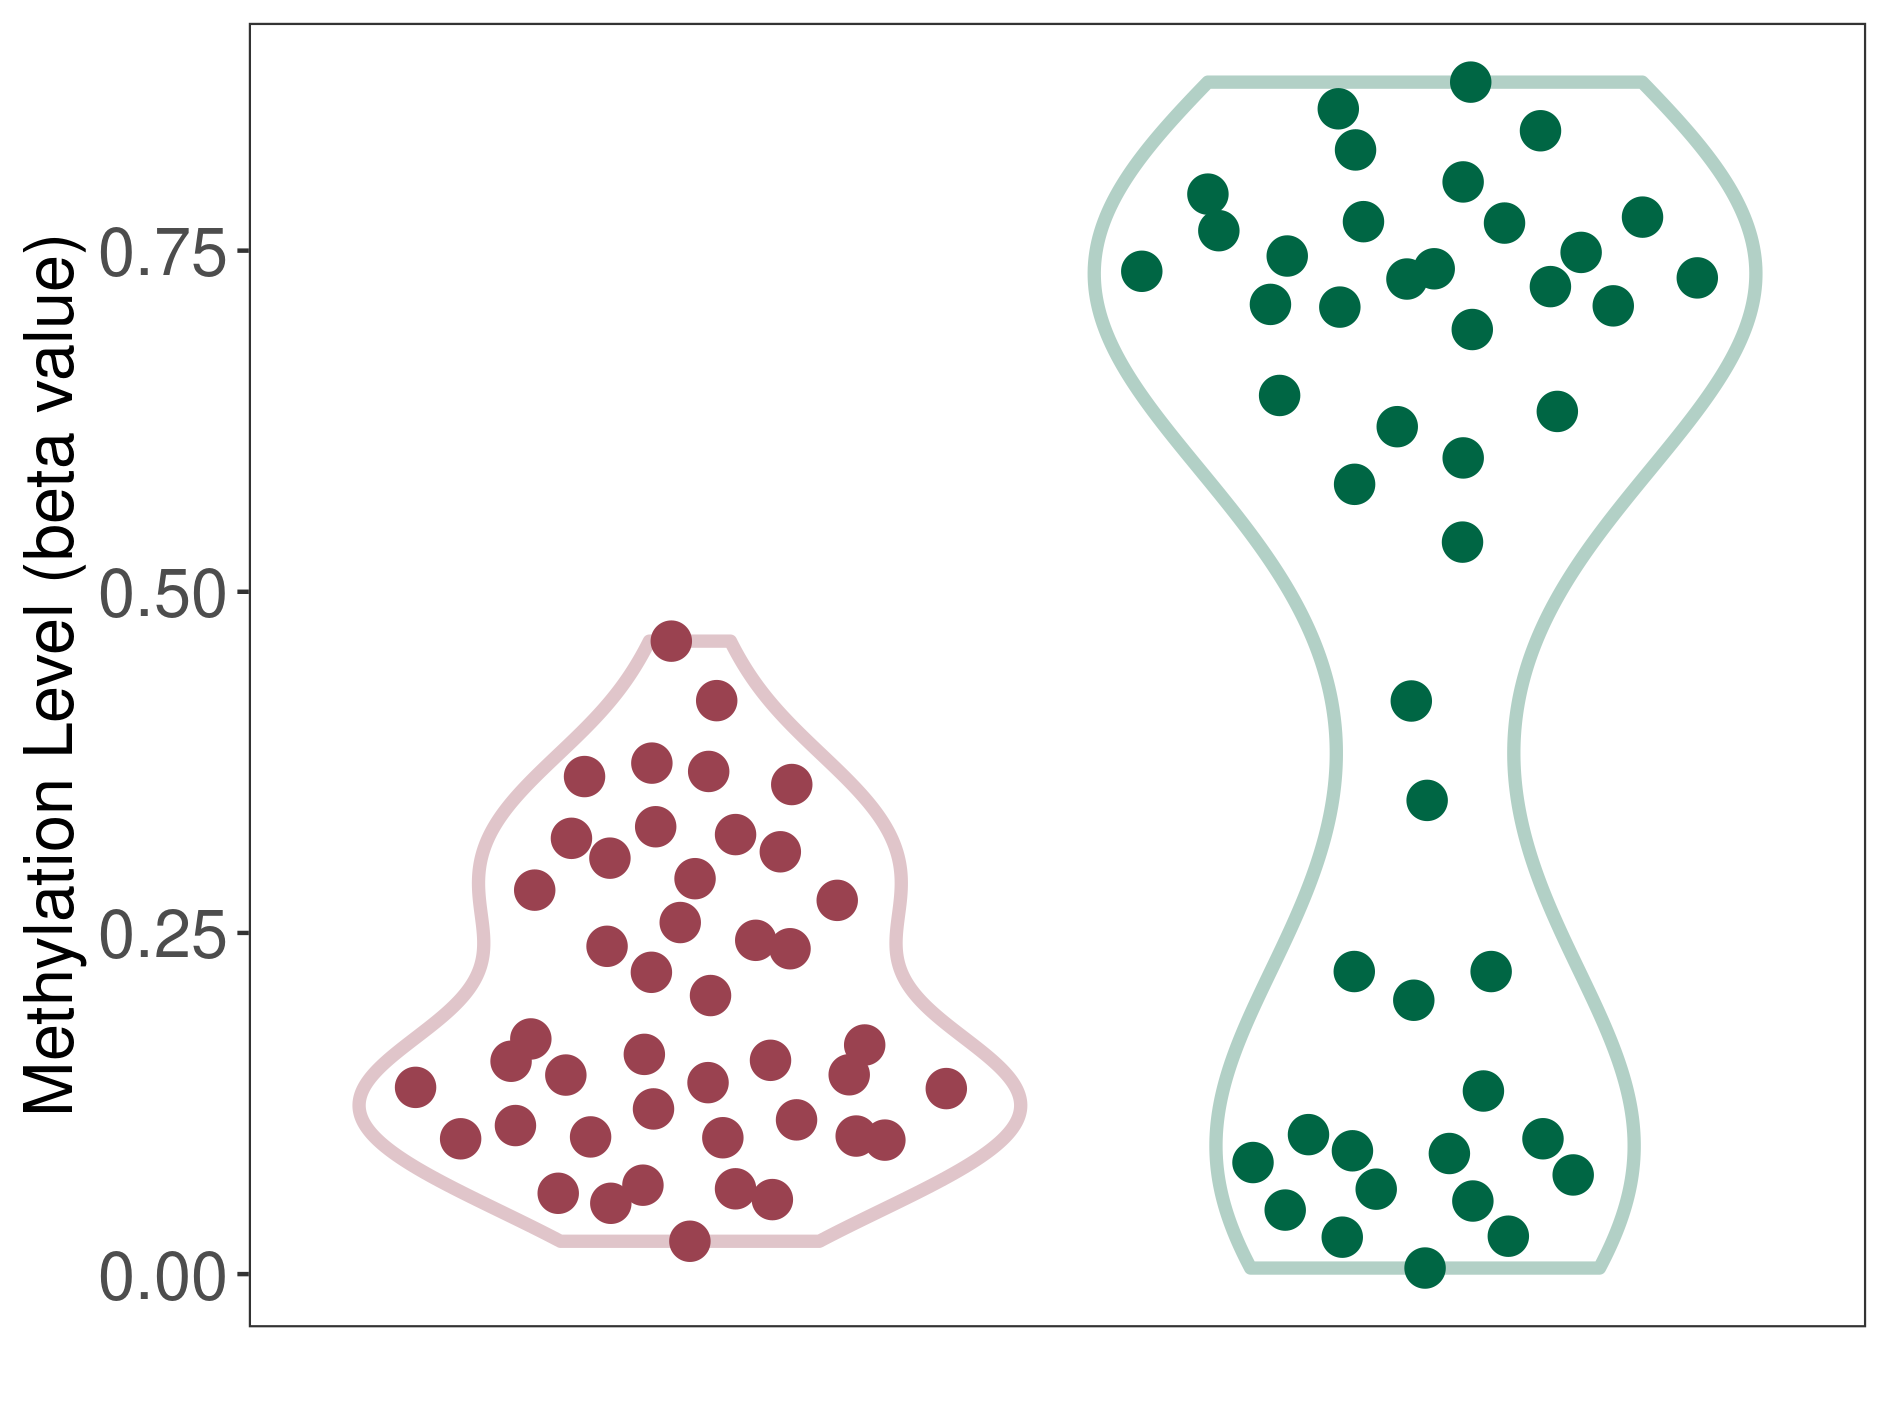
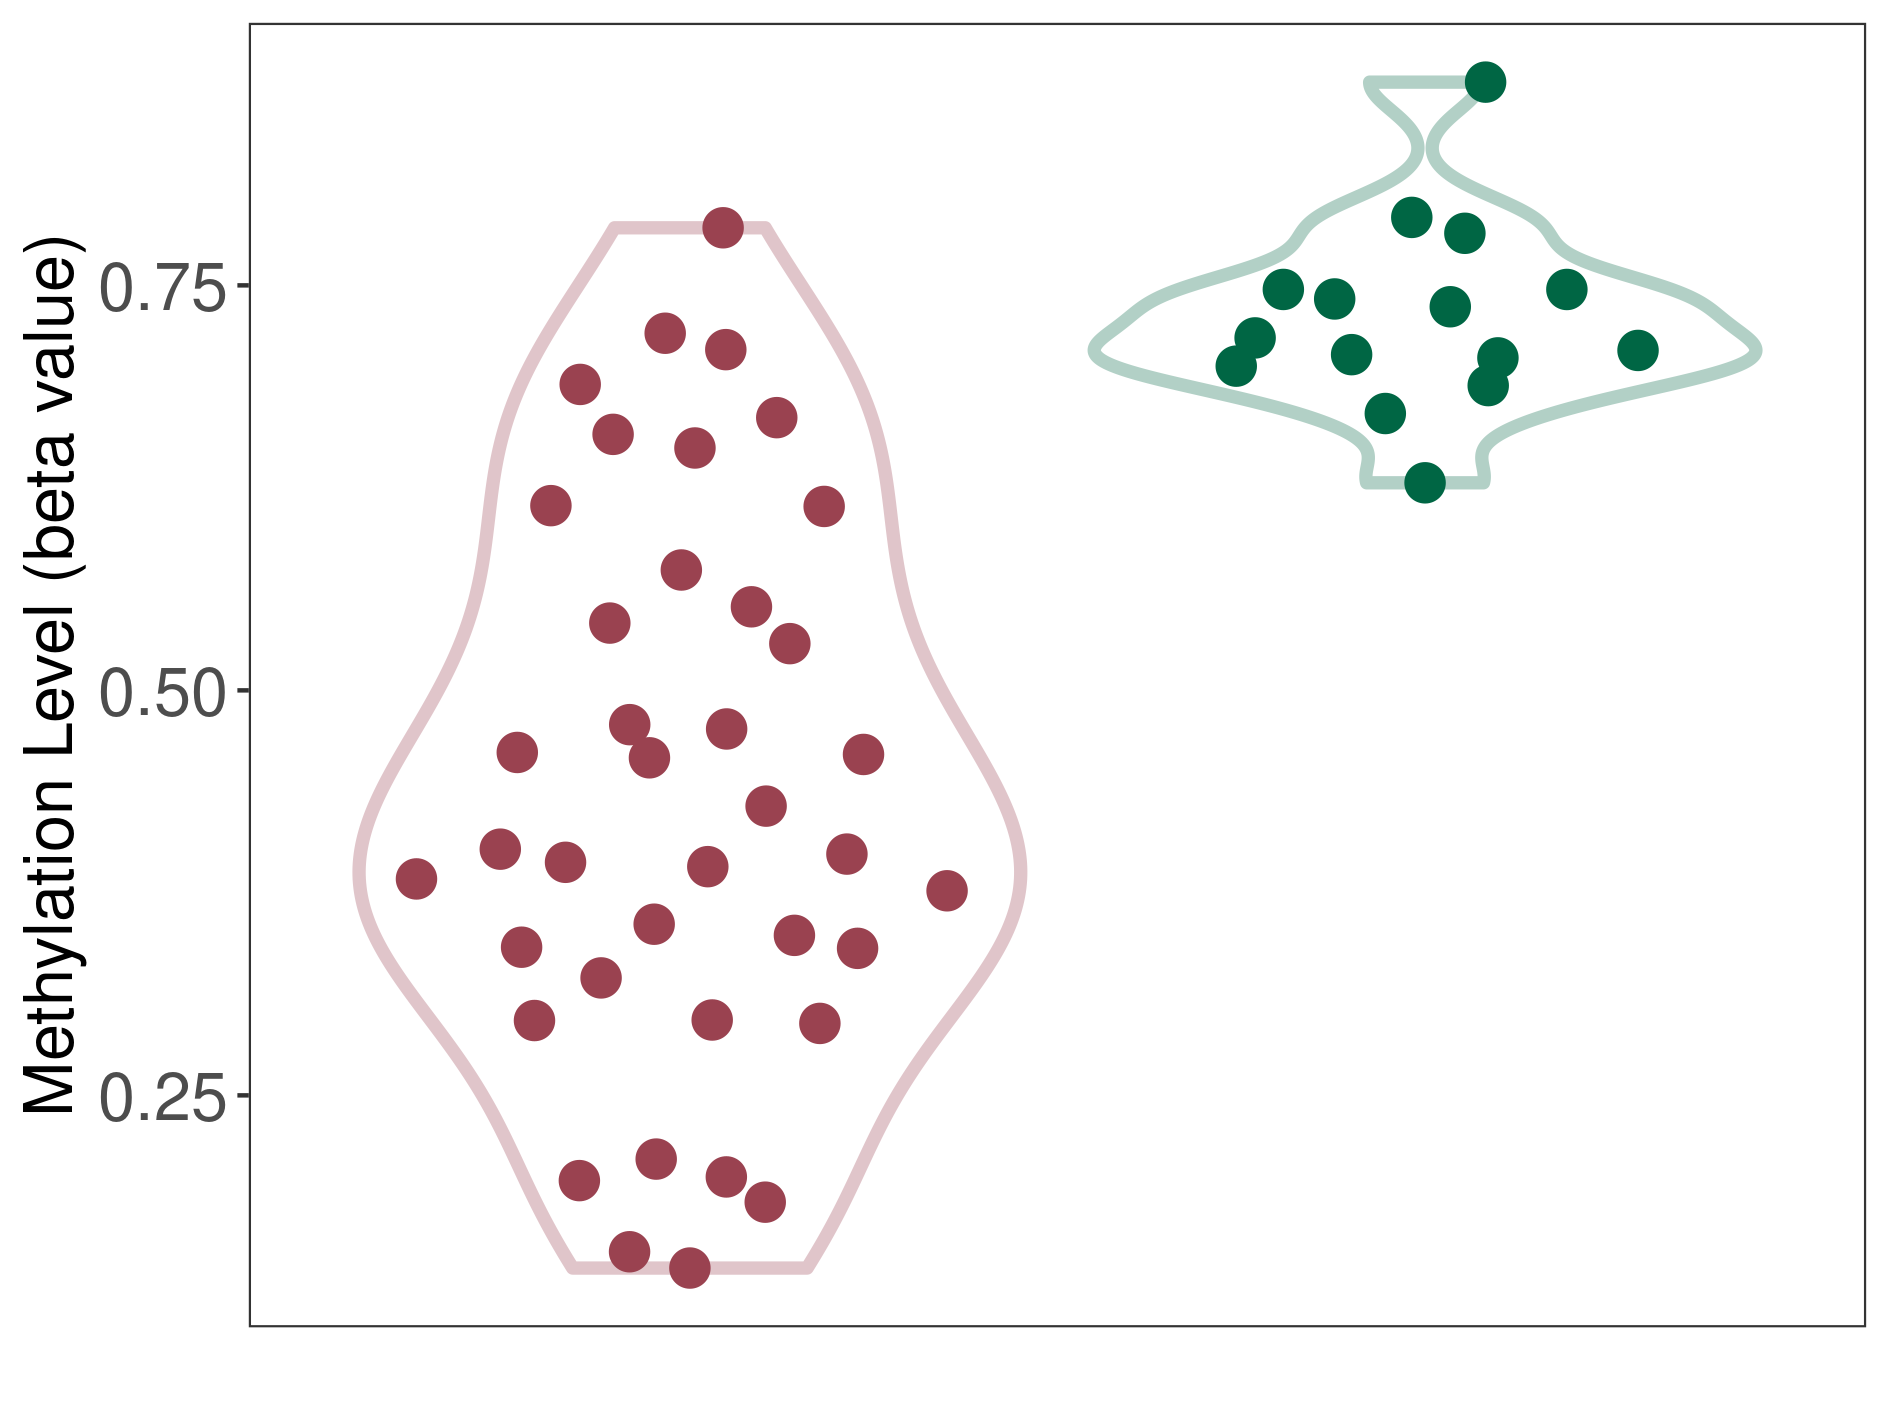
Moderate/significant hypermethylation of SLC10A2 in liver cancer than that in healthy individual/adjacent tissue | ||||
Studied Phenotype |
Liver cancer [ICD-11:2C12] | ||||
The Methylation Level of Disease Section Compare with the Healthy Individual |
p-value: 0.002942996; Fold-change: -0.253835727; Z-score: -1.137524765 | ||||
The Methylation Level of Disease Section Compare with the Adjacent Tissue |
p-value: 2.62E-14; Fold-change: -0.305313068; Z-score: -4.975666743 | ||||
|
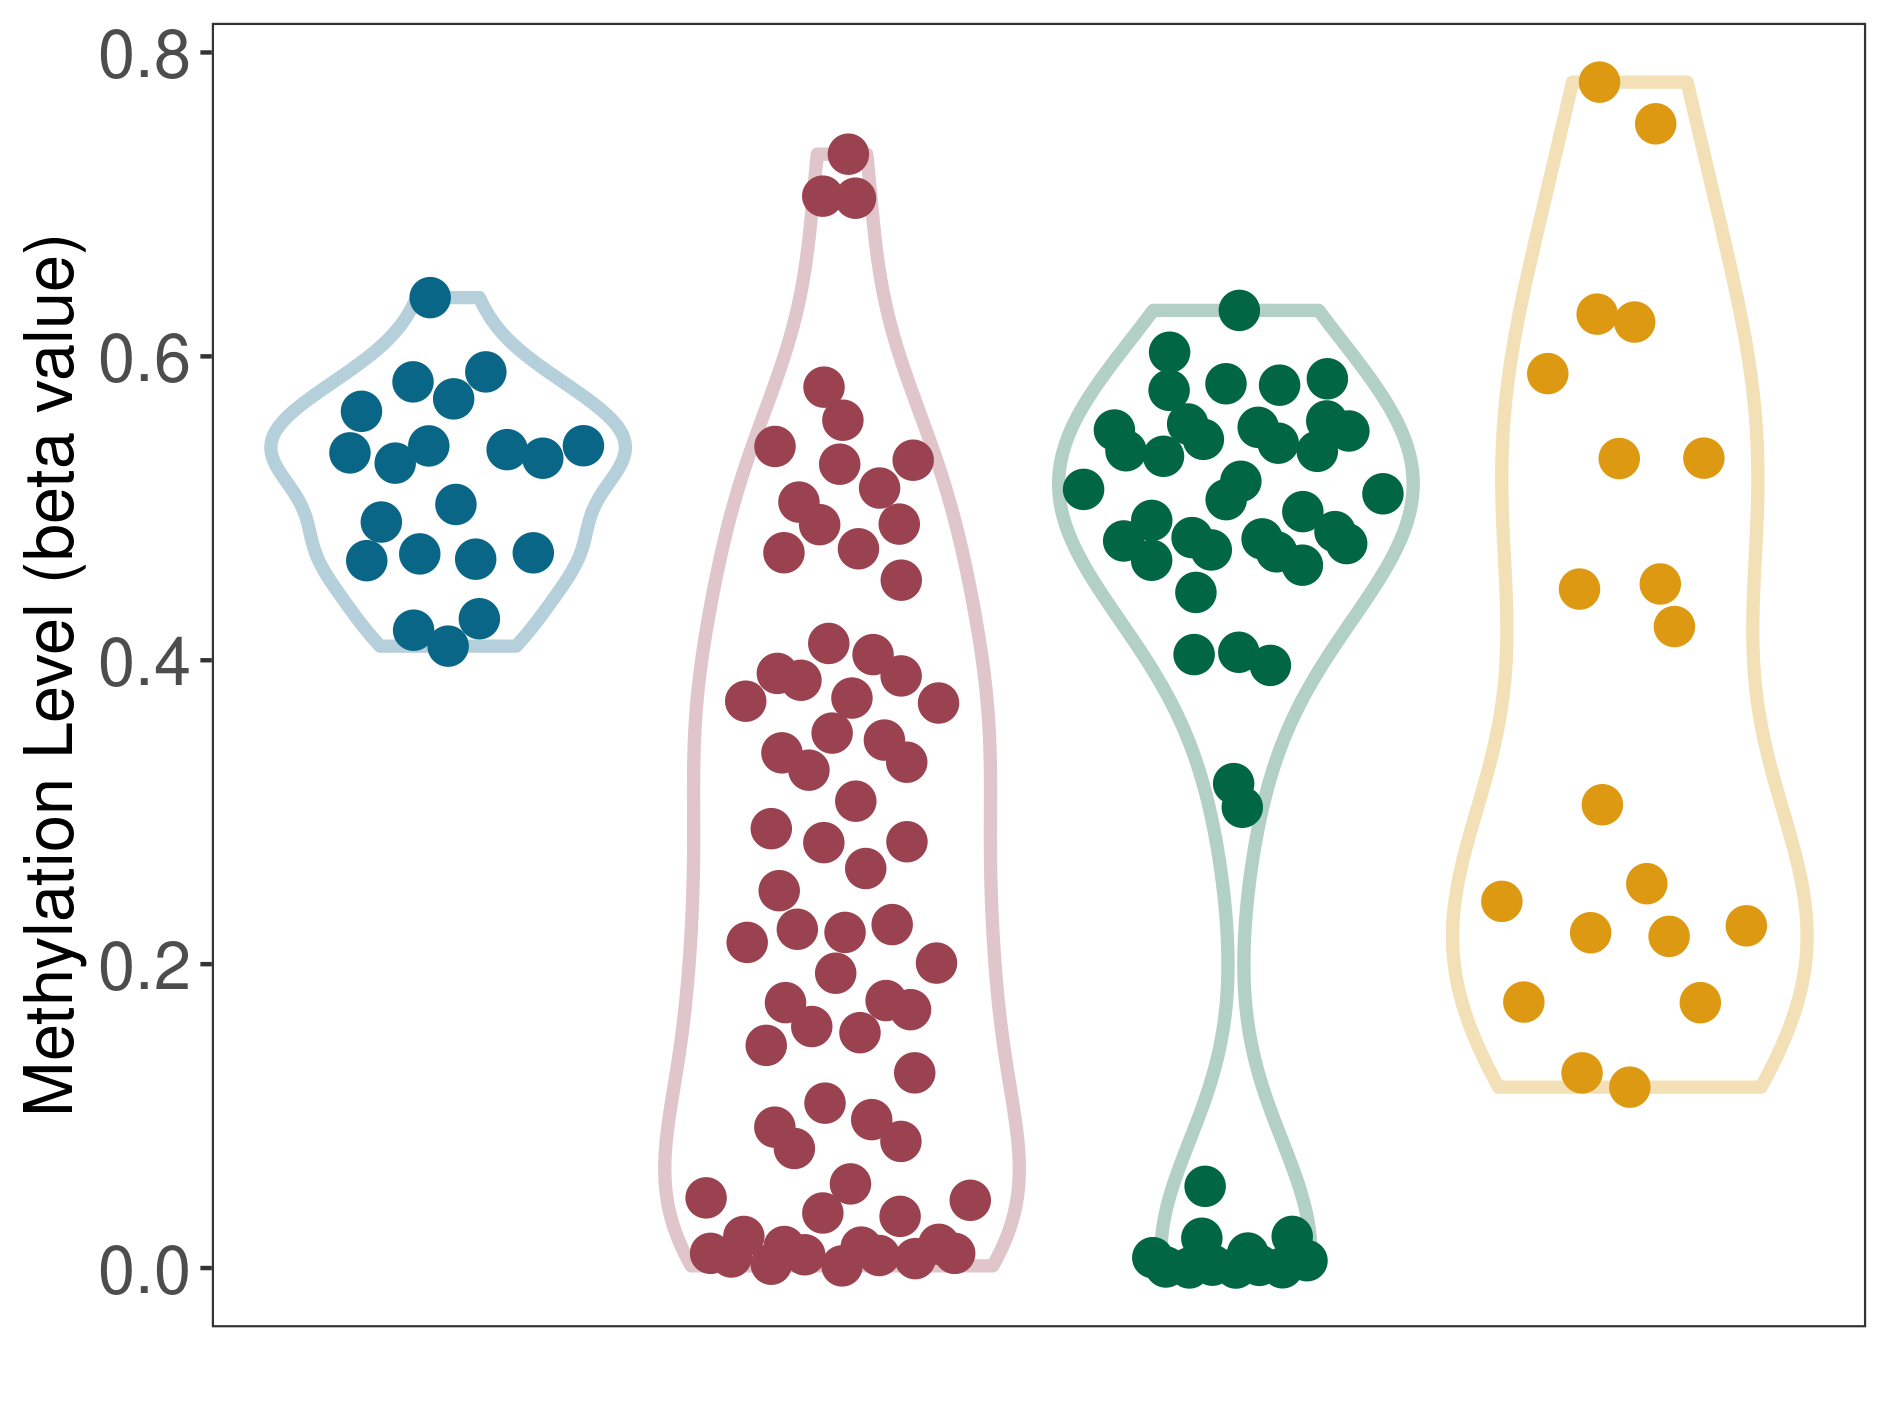
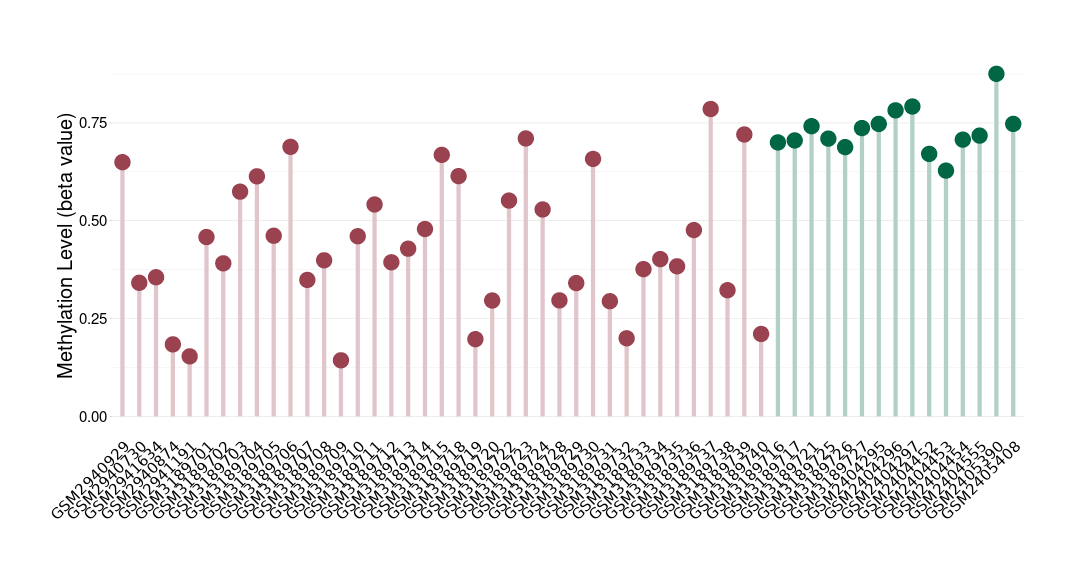
DT methylation level in the diseased tissue of patients
DT methylation level in the normal tissue adjacent to the diseased tissue of patients
DT methylation level in the normal tissue of healthy individuals
DT methylation level in tissue other than the diseased tissue of patients
|
|||||
|
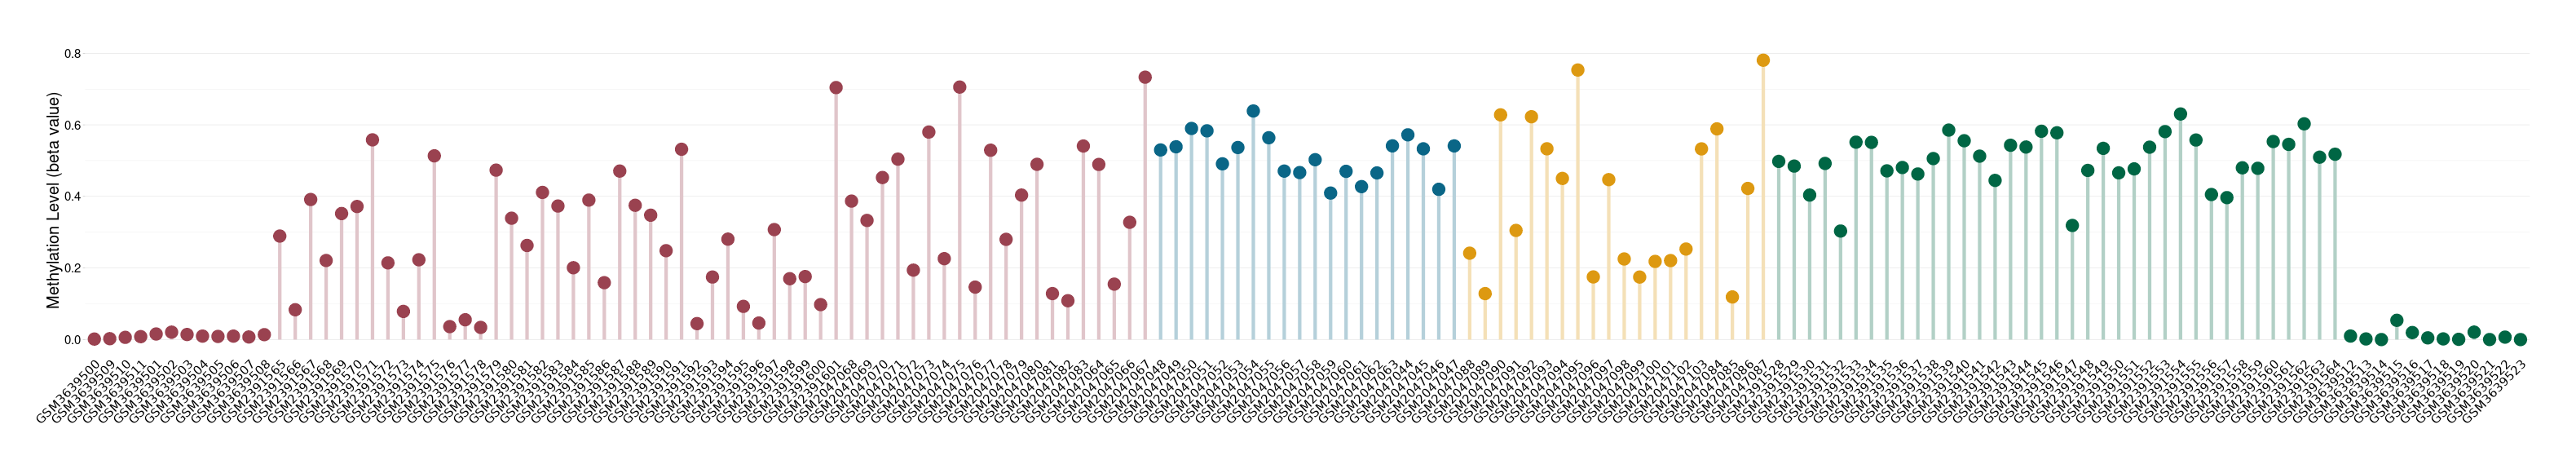 Please Click the above Thumbnail to View/Download
the Methylation Barchart for All Samples
Please Click the above Thumbnail to View/Download
the Methylation Barchart for All Samples
|
||||
|
Esthesioneuroblastoma |
1 Epigenetic Phenomena Related to This Phenotype | Click to Show/Hide the Full List | |||
|
Epigenetic Phenomenon 1 |
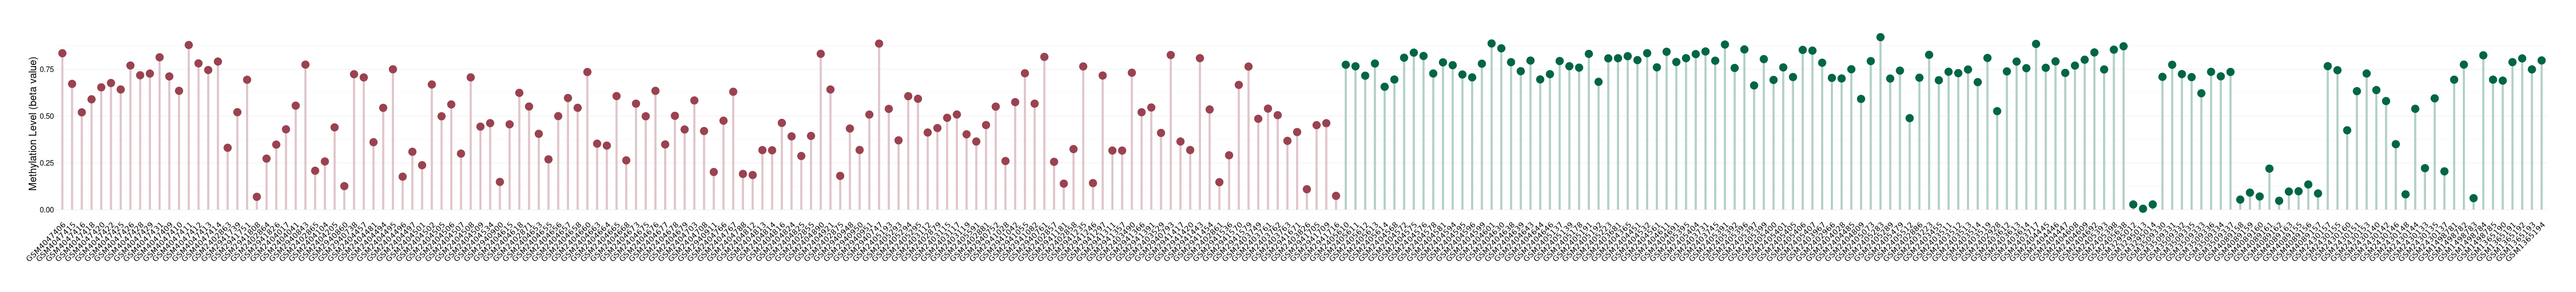
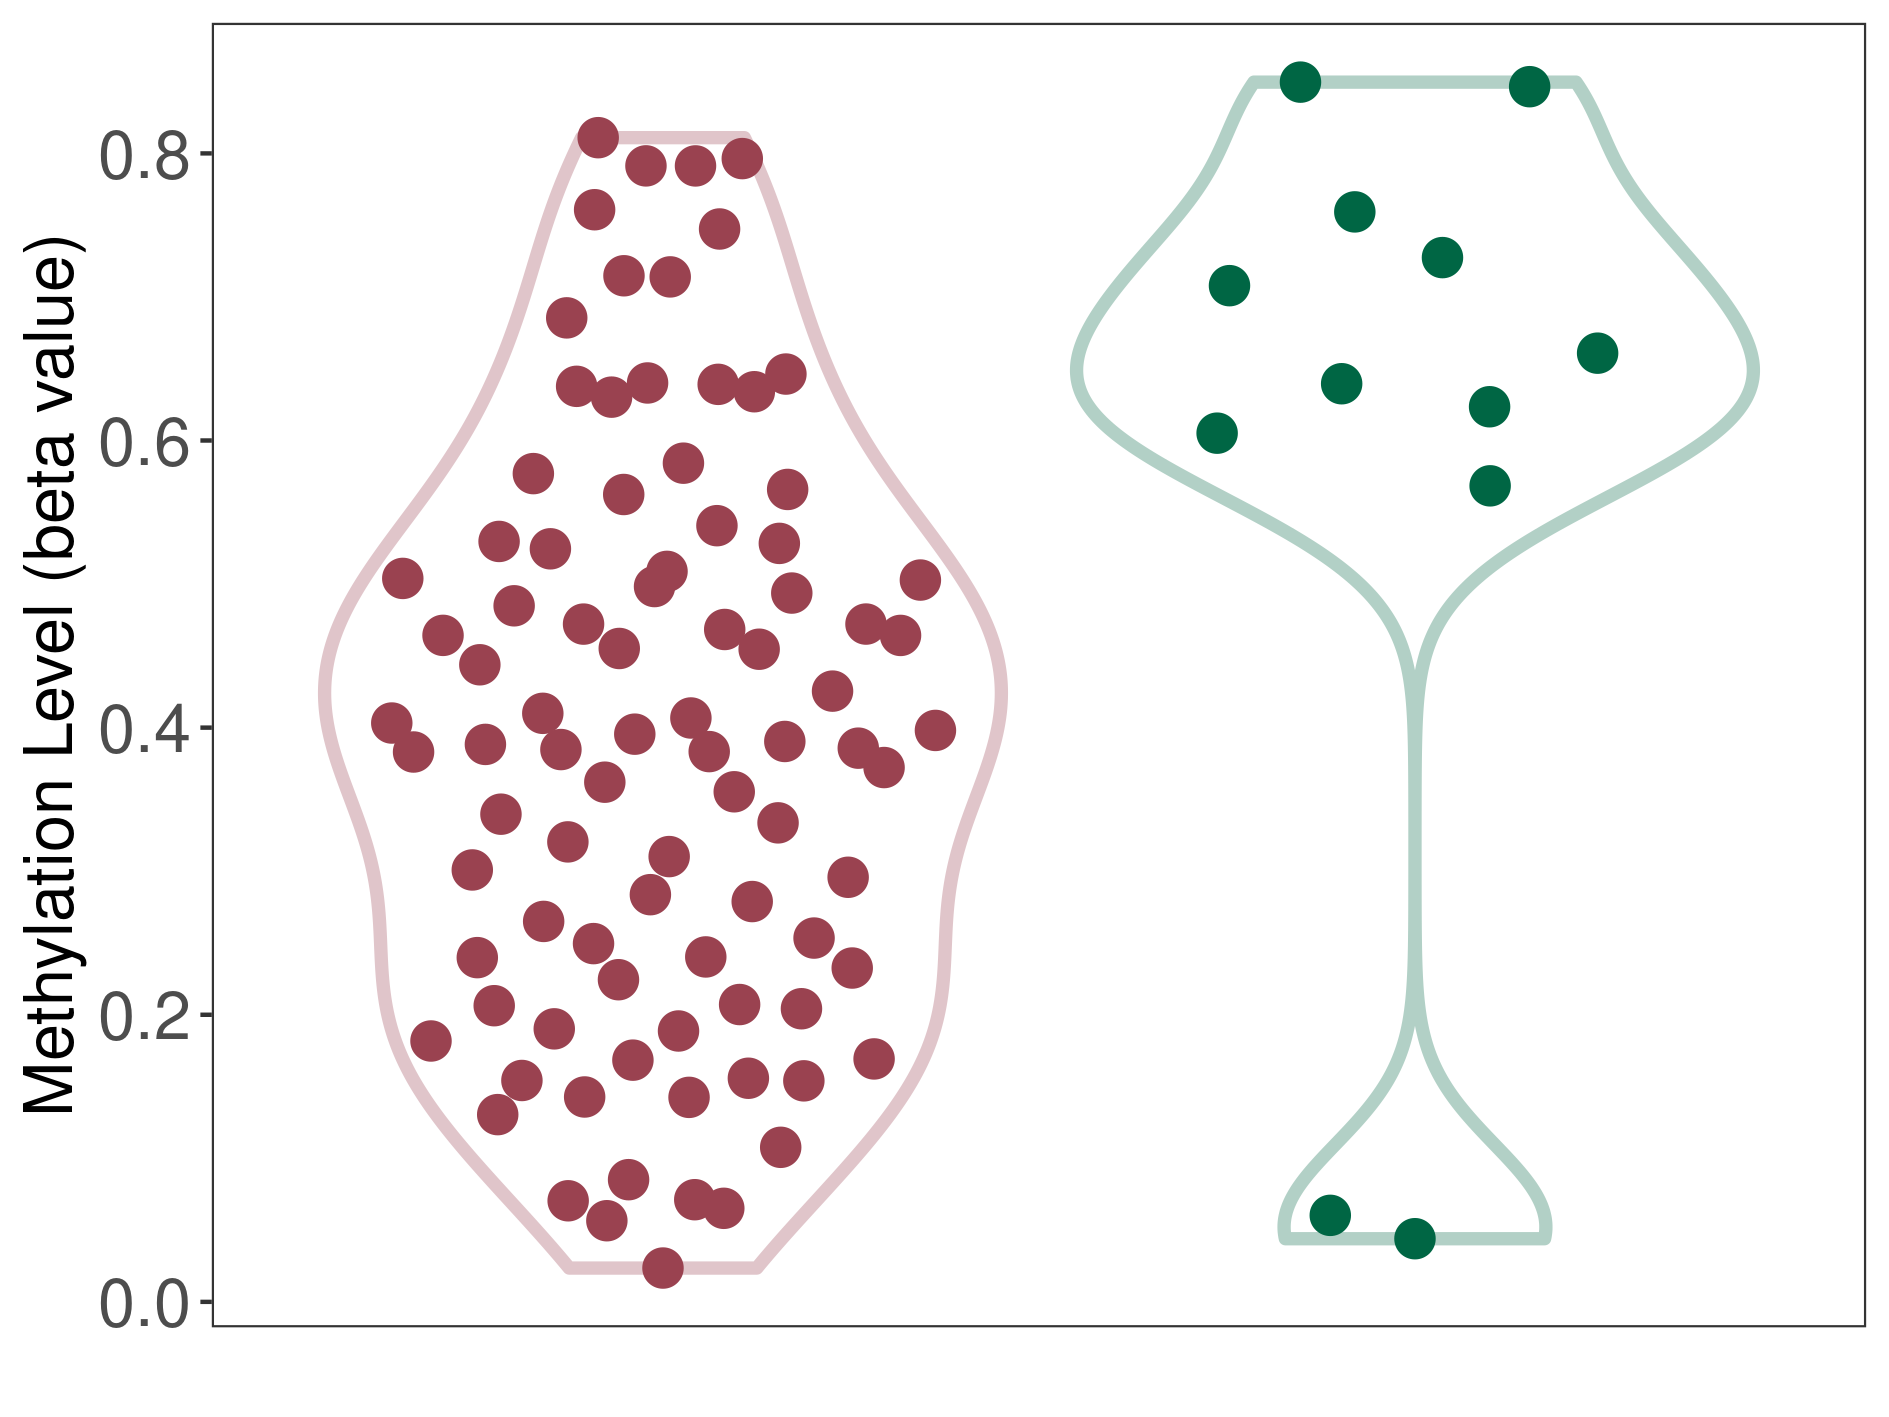
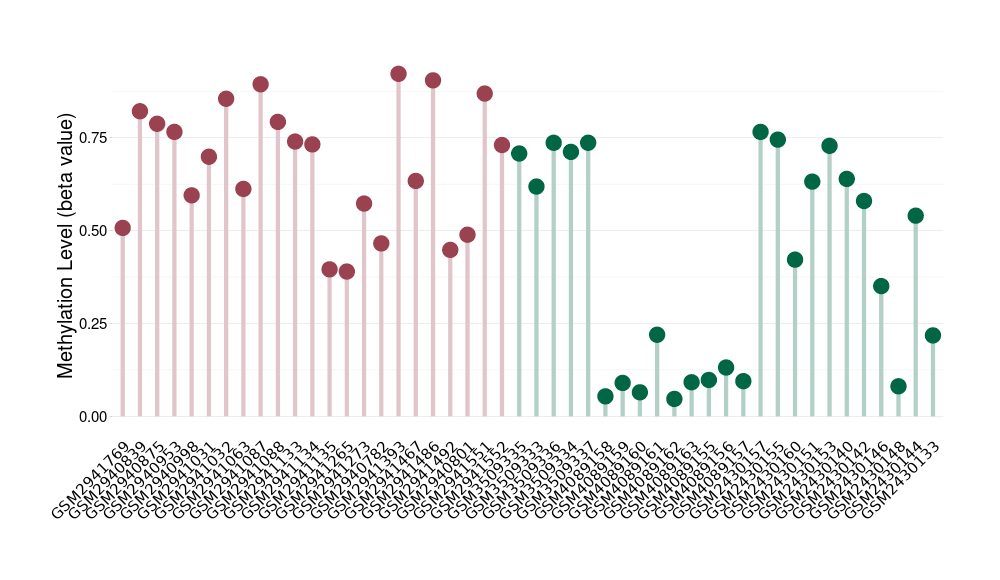
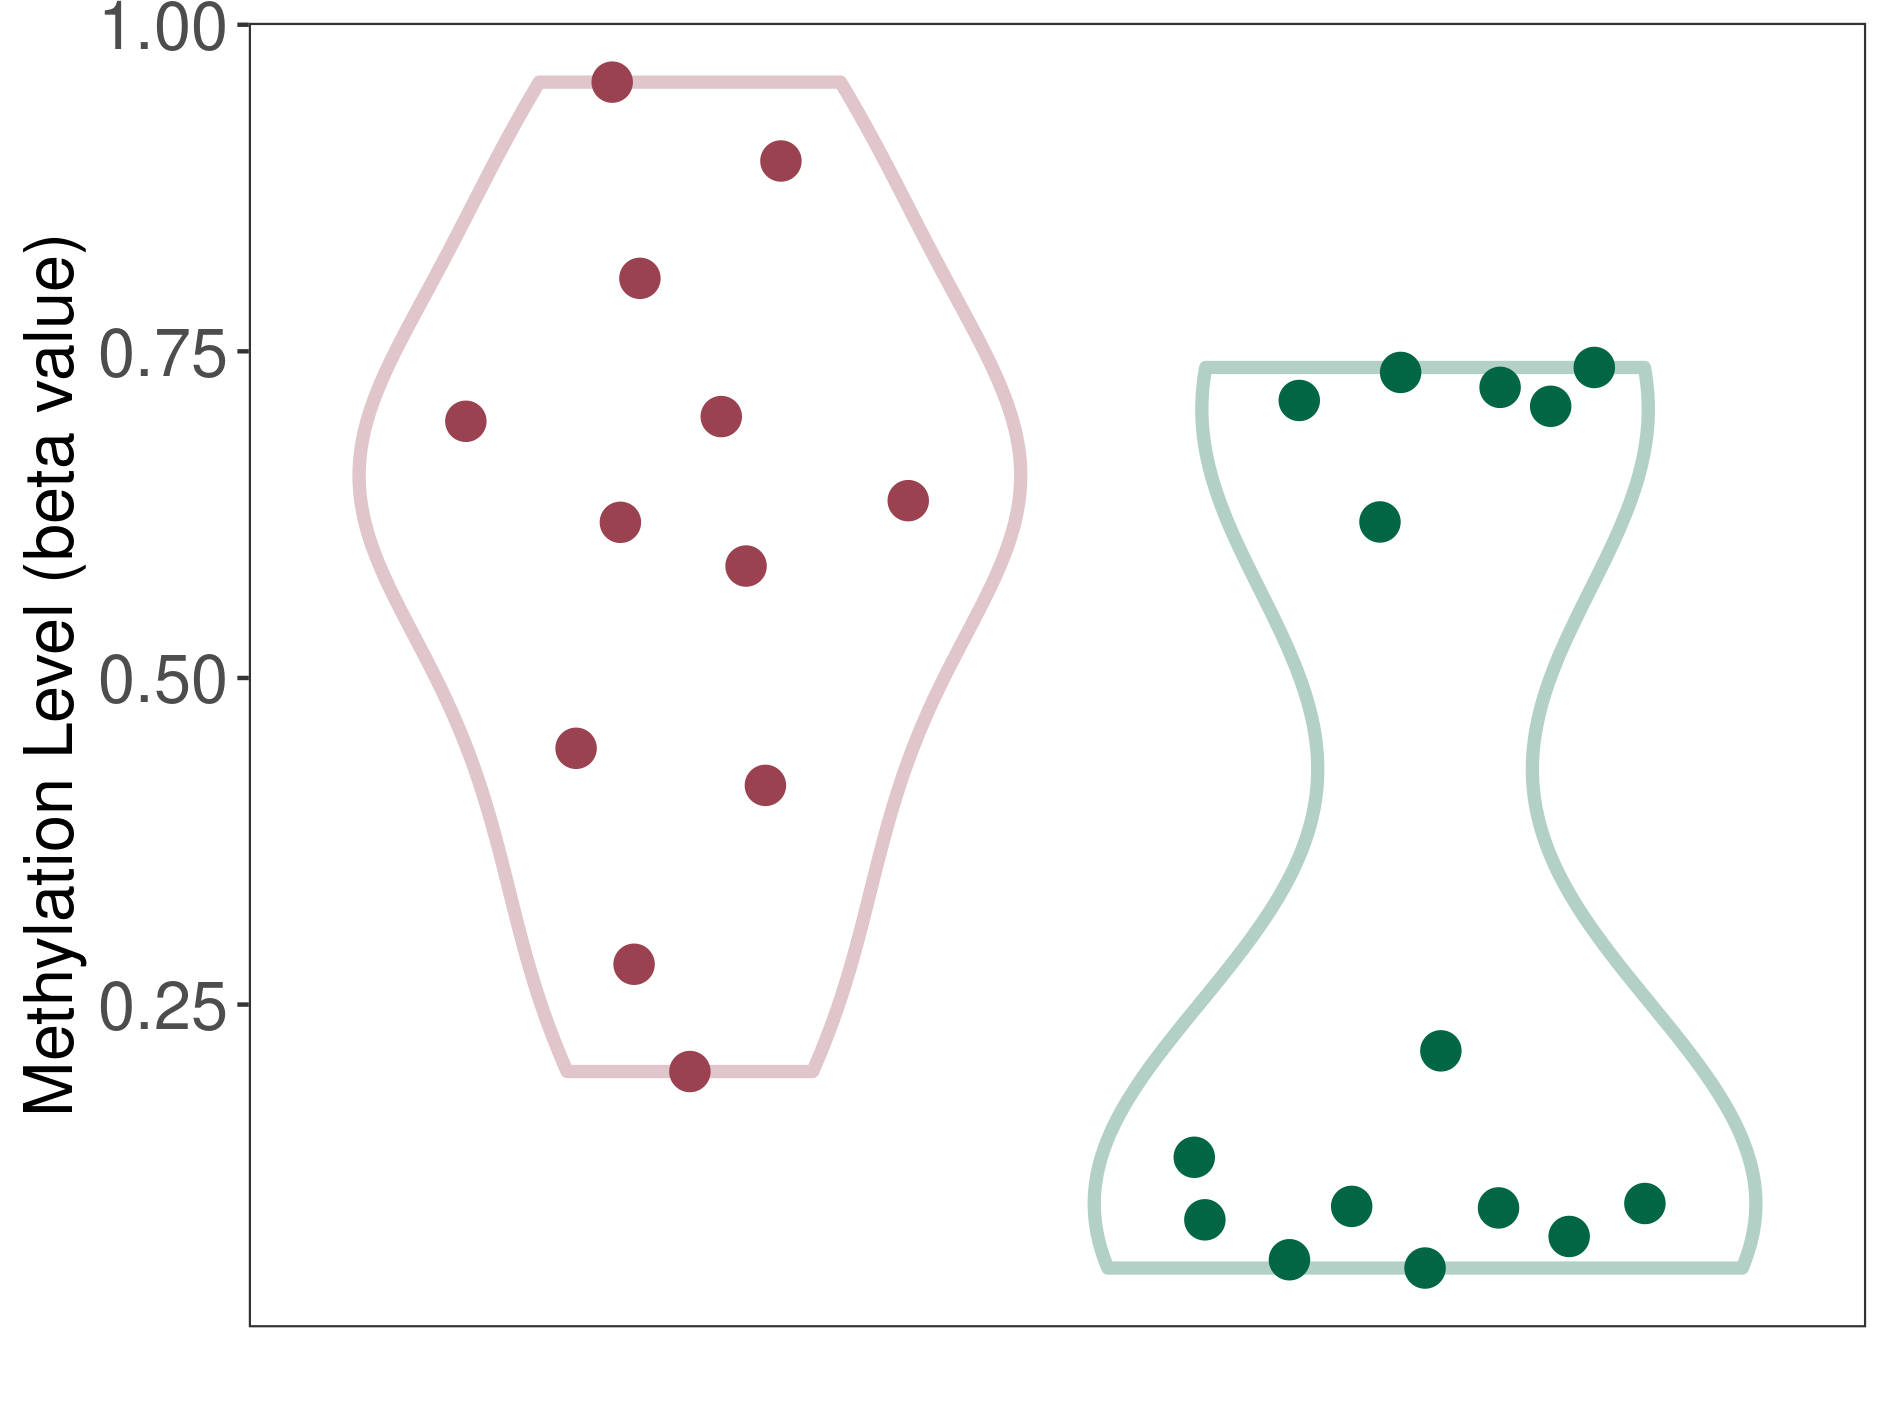
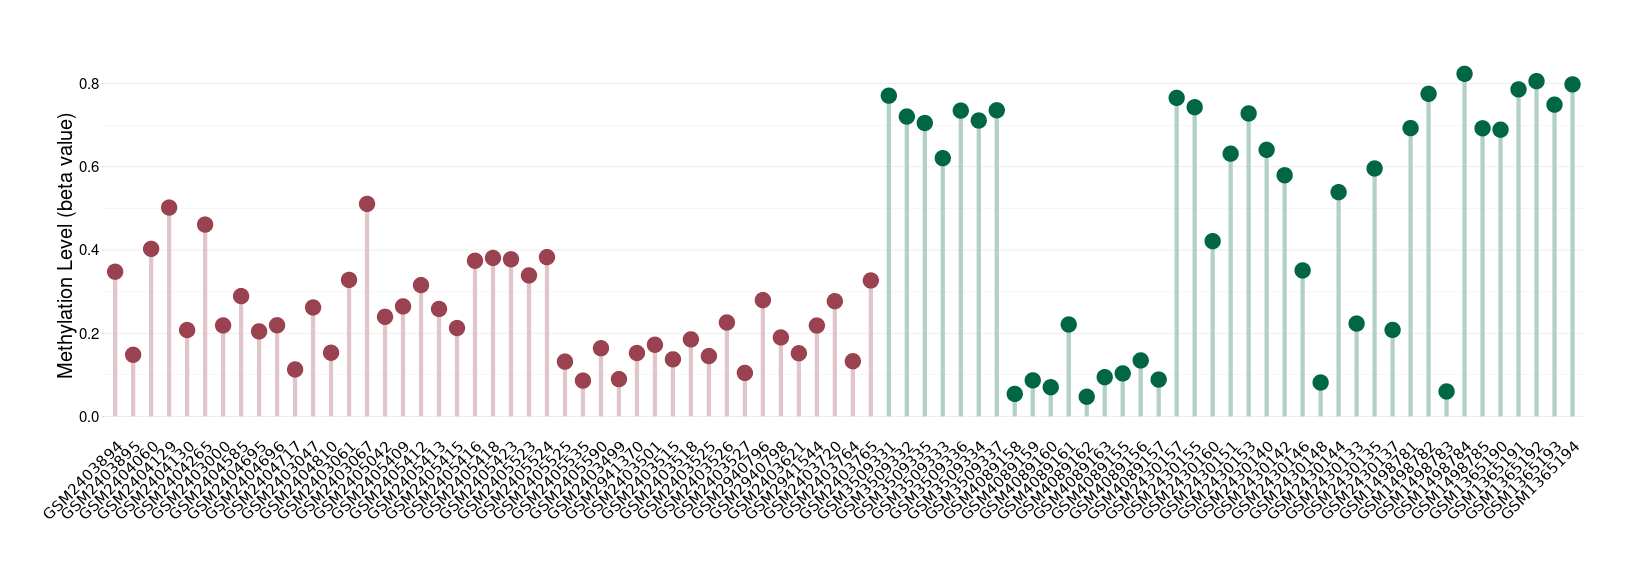
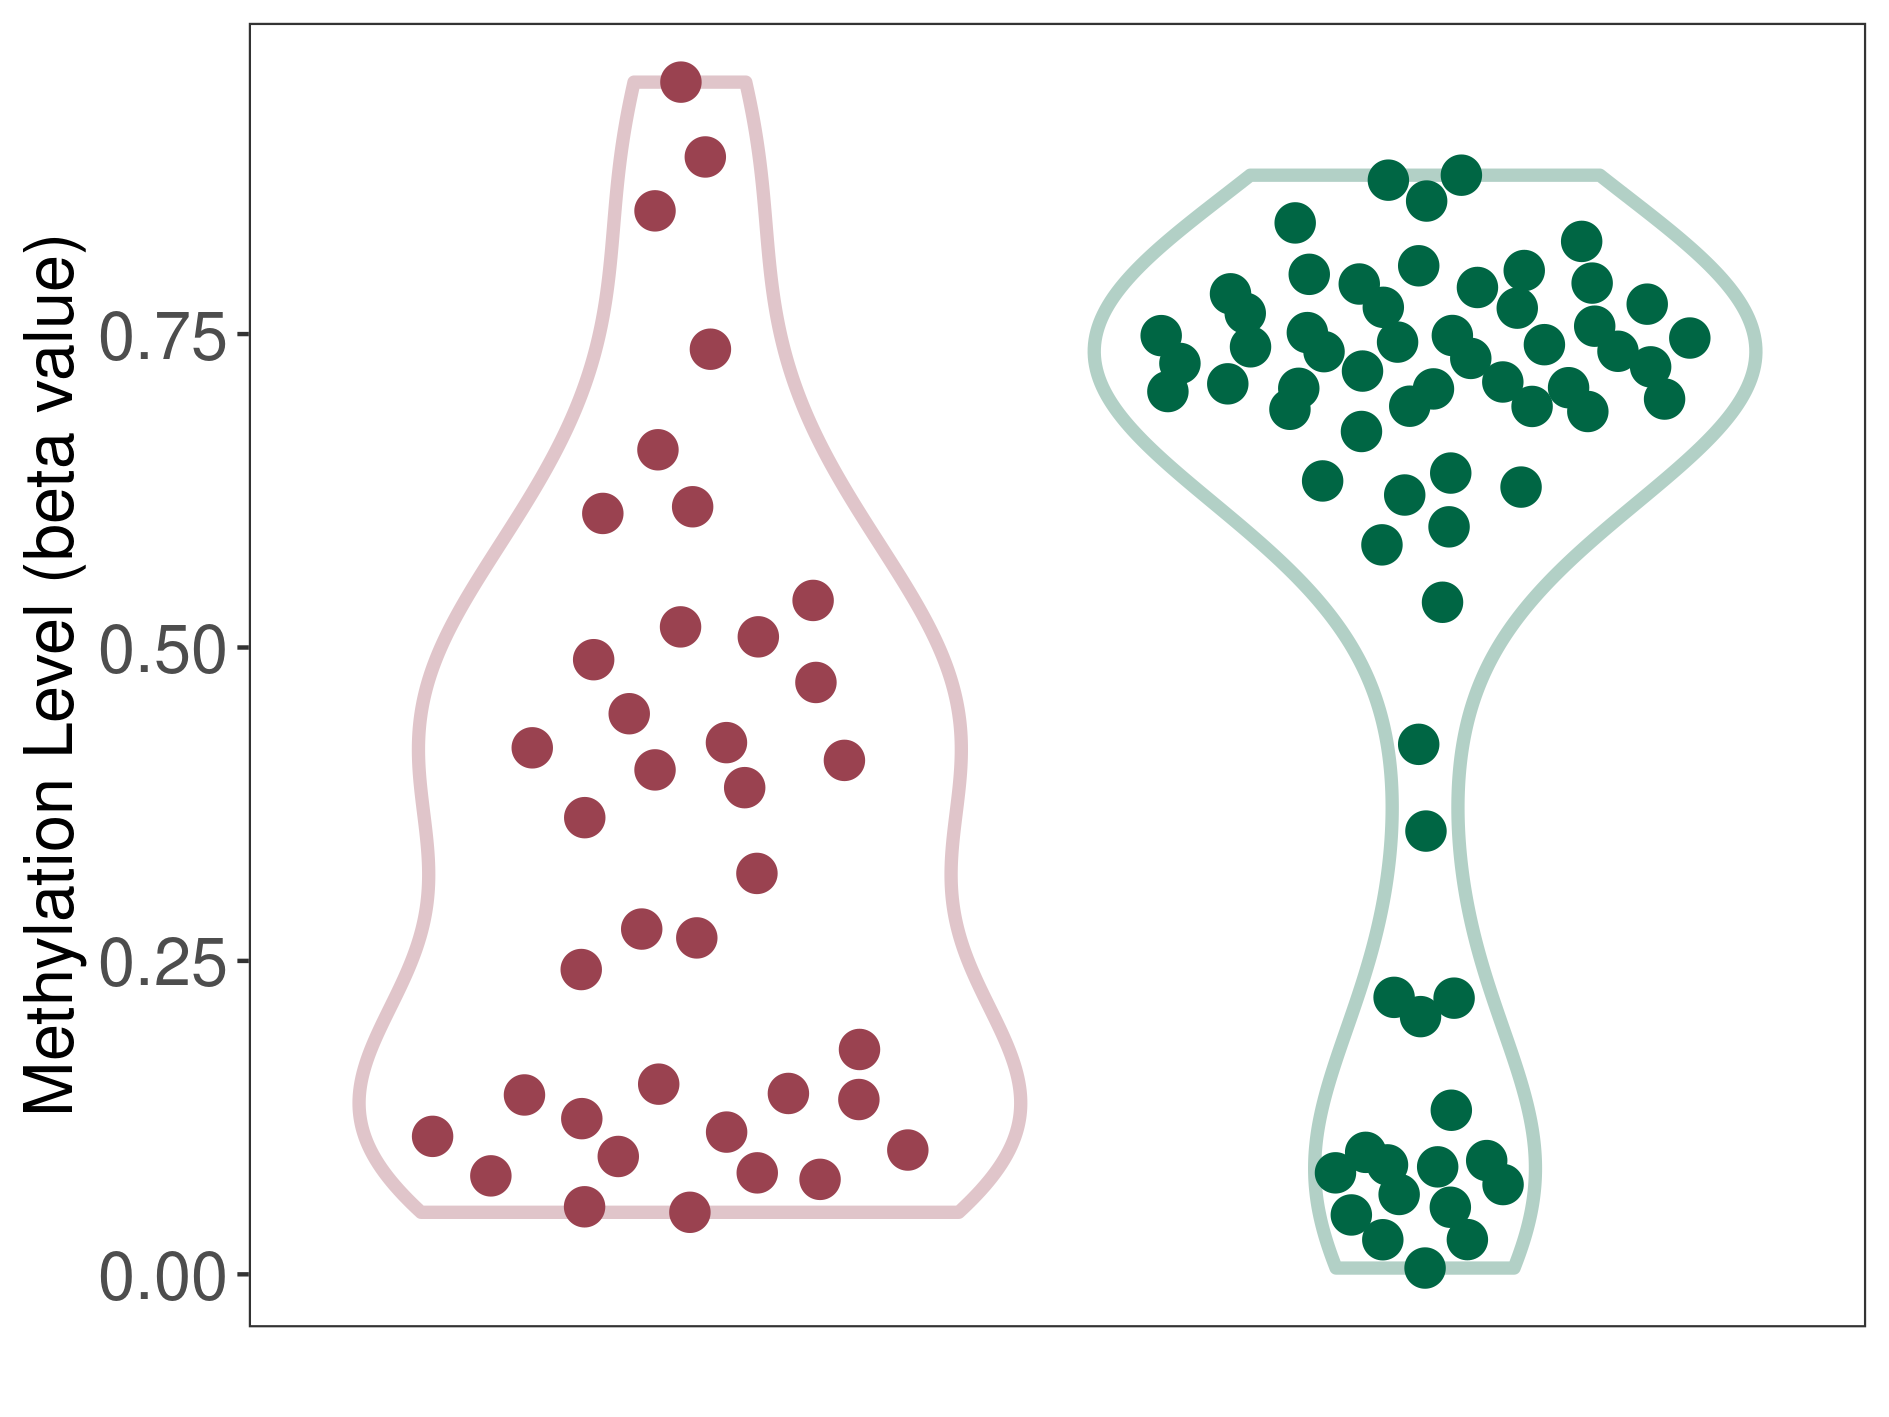
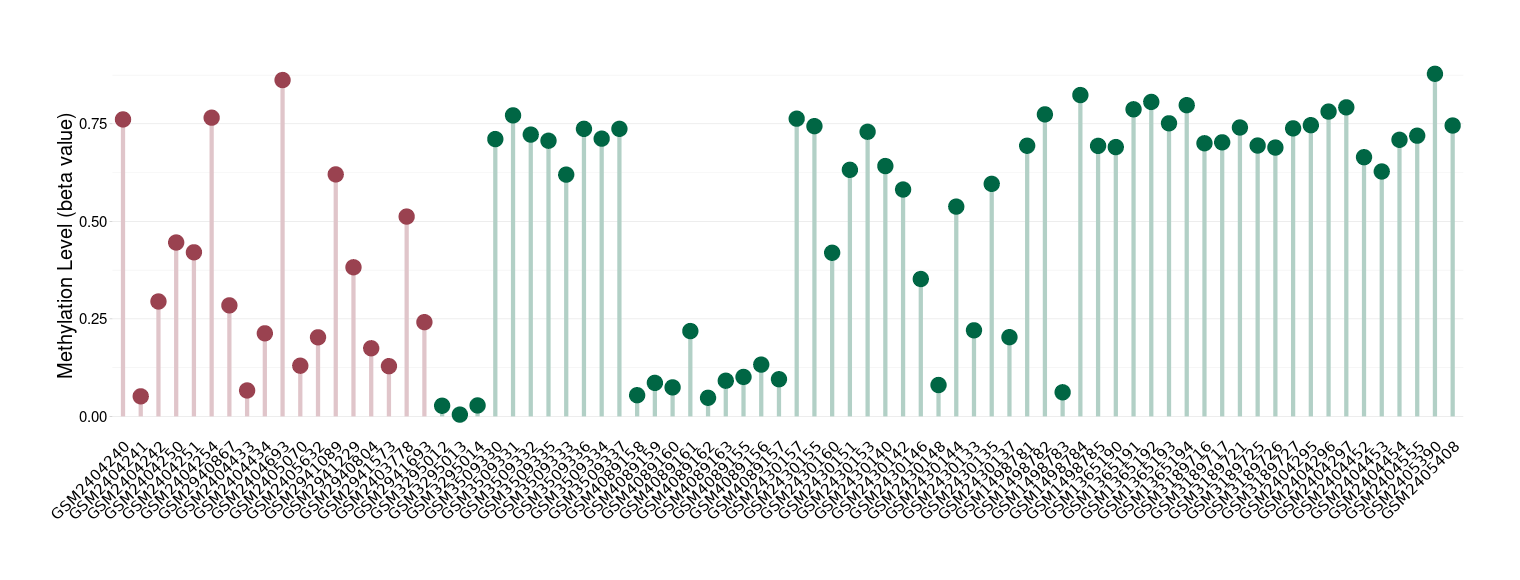
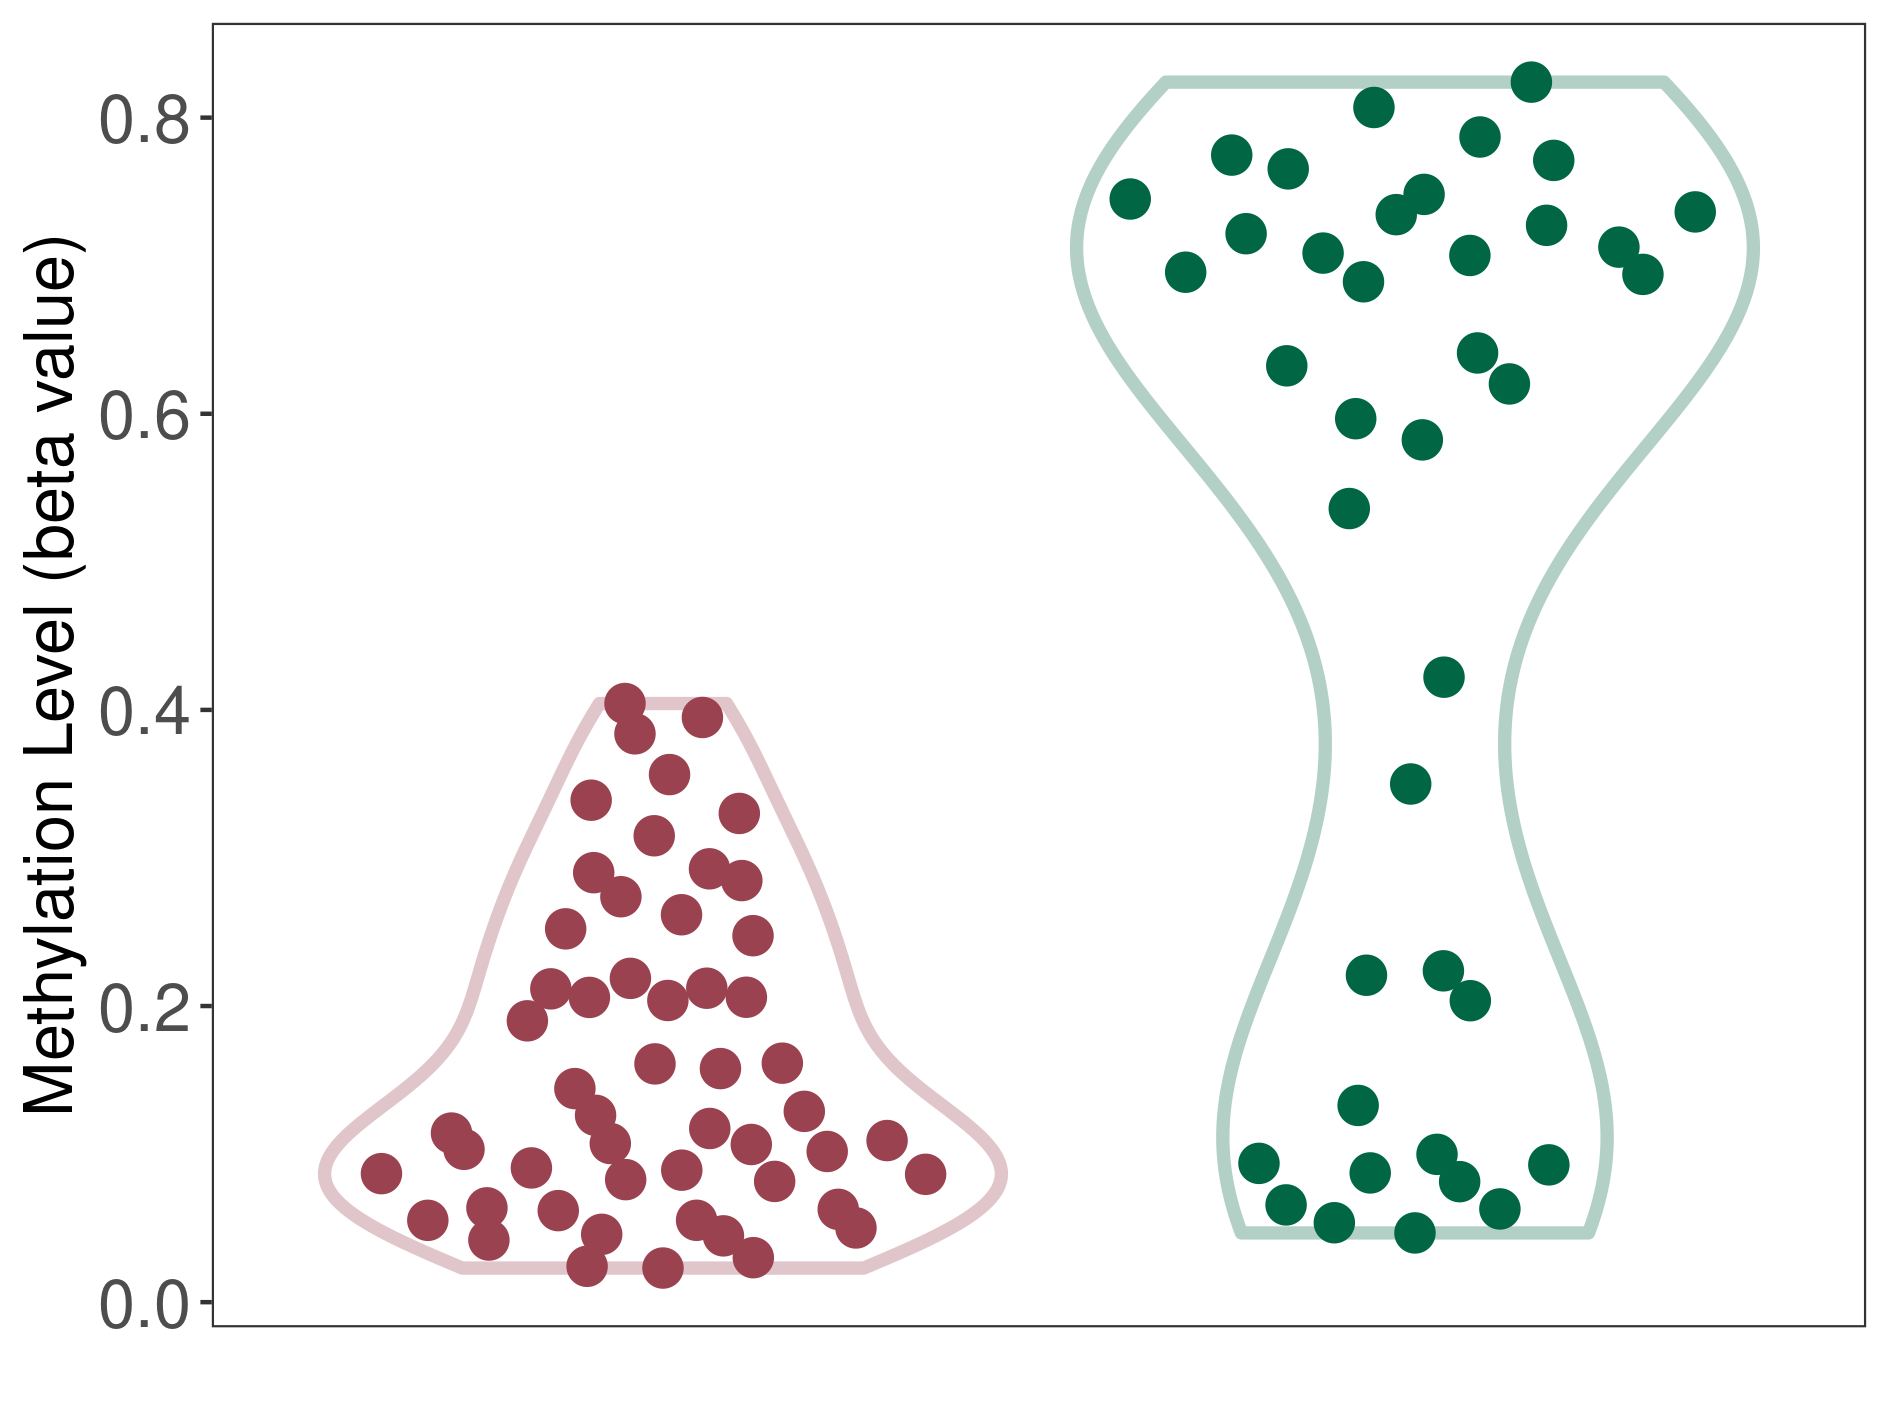
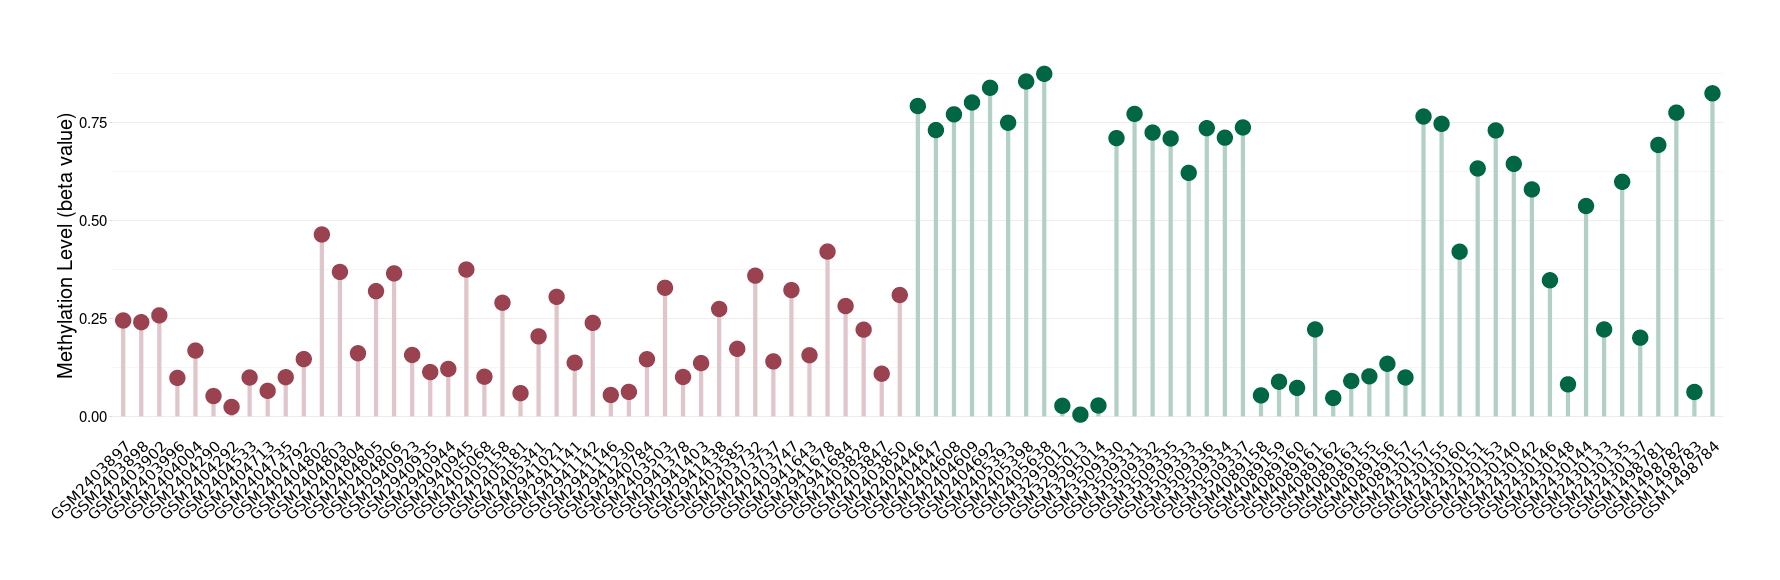
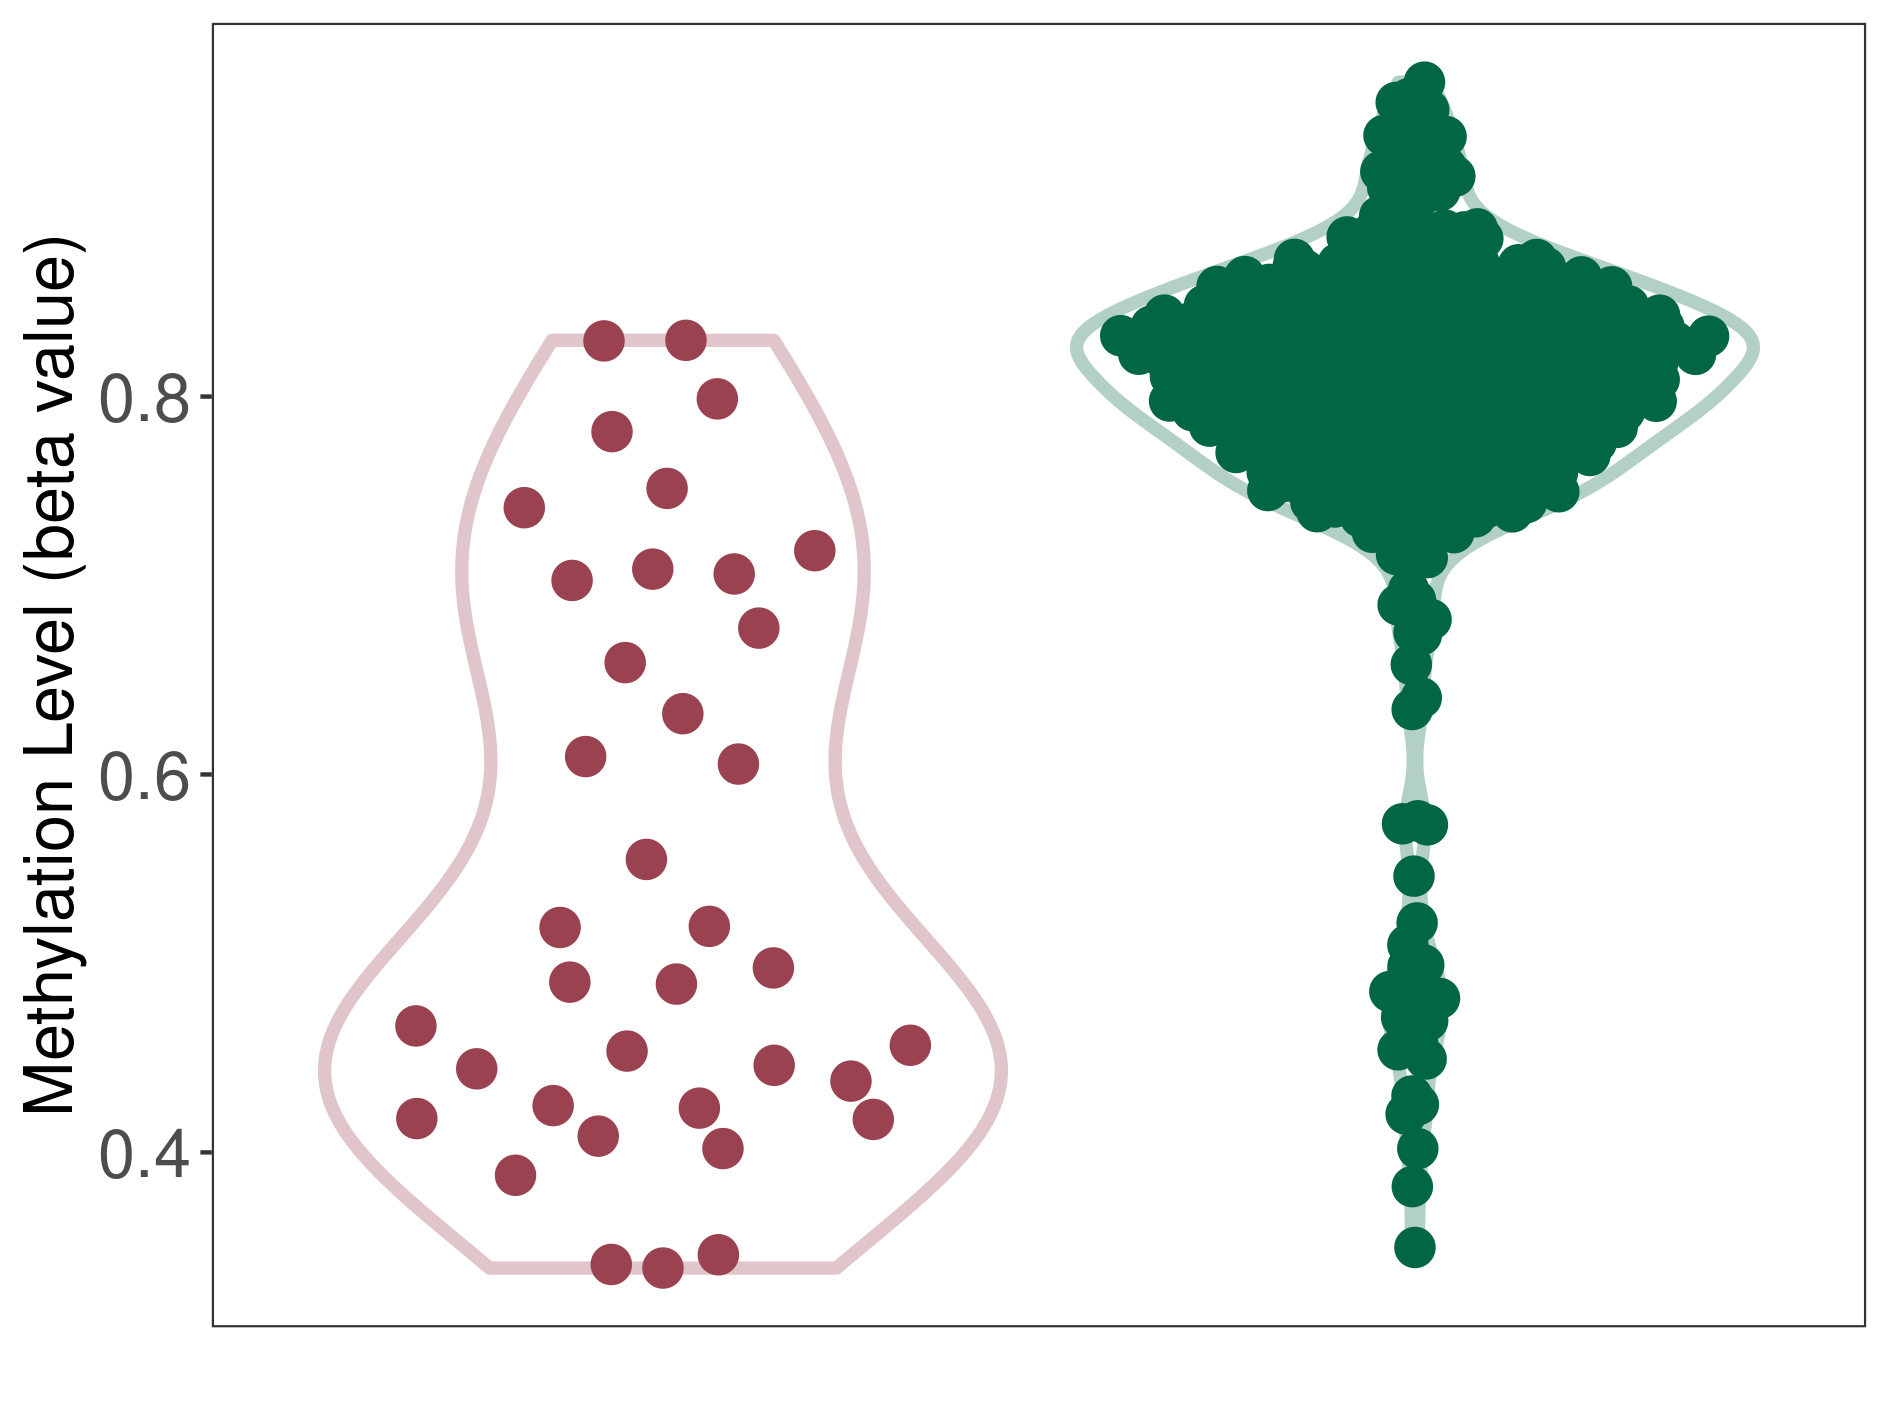
Moderate hypermethylation of SLC10A2 in esthesioneuroblastoma than that in healthy individual | ||||
Studied Phenotype |
Esthesioneuroblastoma [ICD-11:2D50.1] | ||||
The Methylation Level of Disease Section Compare with the Healthy Individual |
p-value: 6.28E-08; Fold-change: 0.287799339; Z-score: 1.016833661 | ||||
|
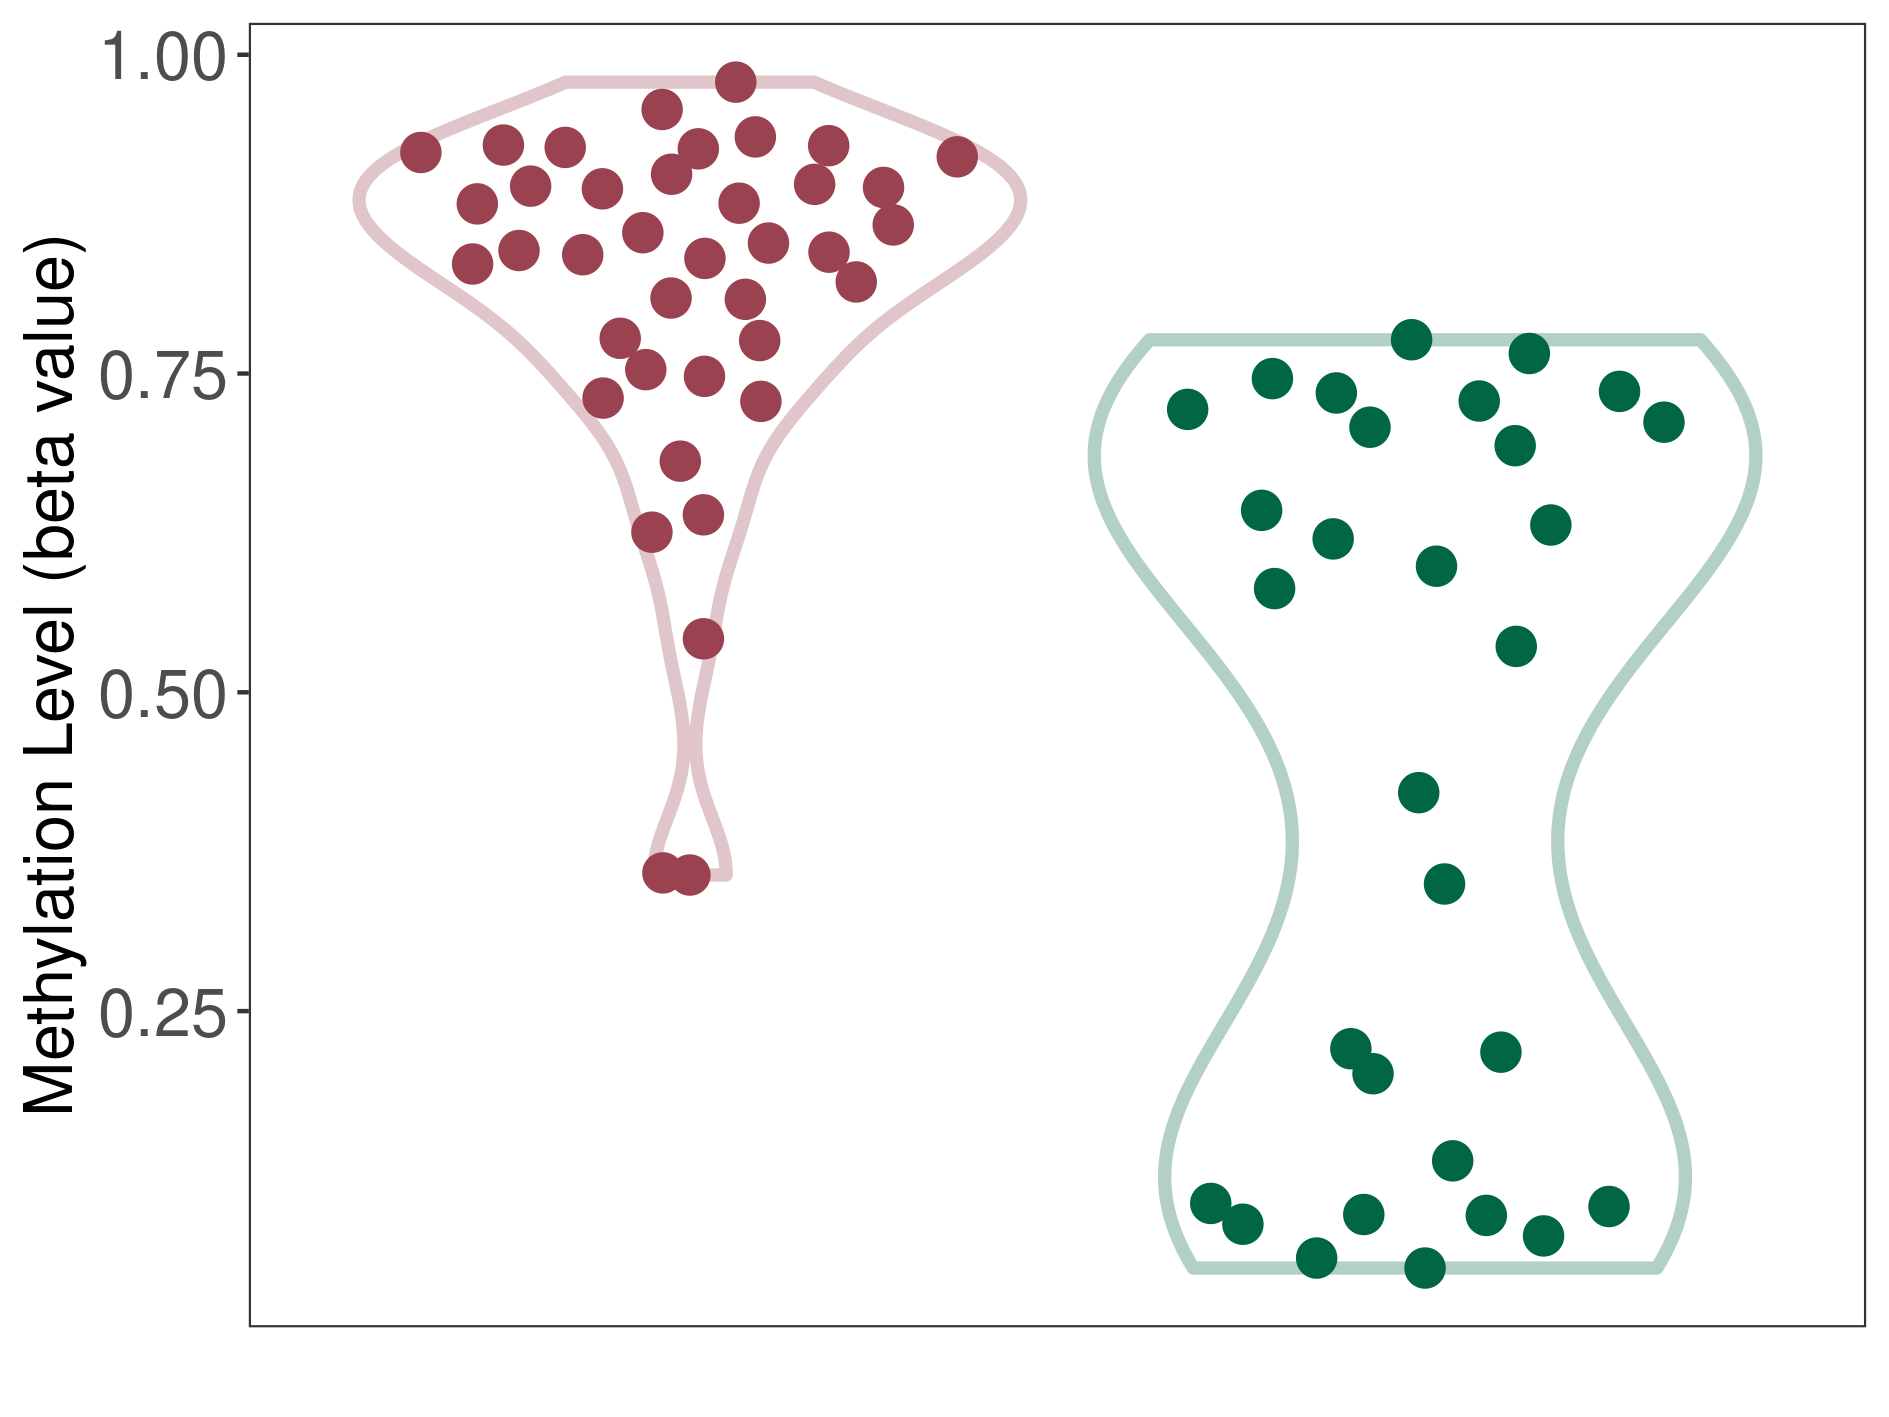
DT methylation level in the diseased tissue of patients
DT methylation level in the normal tissue of healthy individuals
|
|||||
|
 Please Click the above Thumbnail to View/Download
the Methylation Barchart for All Samples
Please Click the above Thumbnail to View/Download
the Methylation Barchart for All Samples
|
||||
|
Diffuse midline glioma |
1 Epigenetic Phenomena Related to This Phenotype | Click to Show/Hide the Full List | |||
|
Epigenetic Phenomenon 1 |
Moderate hypomethylation of SLC10A2 in diffuse midline glioma than that in healthy individual | ||||
Studied Phenotype |
Diffuse midline glioma [ICD-11:2A00.0Z] | ||||
The Methylation Level of Disease Section Compare with the Healthy Individual |
p-value: 1.17E-09; Fold-change: -0.247869571; Z-score: -1.046486237 | ||||
|
DT methylation level in the diseased tissue of patients
DT methylation level in the normal tissue of healthy individuals
|
|||||
|
 Please Click the above Thumbnail to View/Download
the Methylation Barchart for All Samples
Please Click the above Thumbnail to View/Download
the Methylation Barchart for All Samples
|
||||
|
Uterine carcinosarcoma |
1 Epigenetic Phenomena Related to This Phenotype | Click to Show/Hide the Full List | |||
|
Epigenetic Phenomenon 1 |
Moderate hypomethylation of SLC10A2 in uterine carcinosarcoma than that in healthy individual | ||||
Studied Phenotype |
Uterine carcinosarcoma [ICD-11:2B5F] | ||||
The Methylation Level of Disease Section Compare with the Healthy Individual |
p-value: 0.02836966; Fold-change: -0.260857039; Z-score: -0.977957851 | ||||
|
DT methylation level in the diseased tissue of patients
DT methylation level in the normal tissue of healthy individuals
|
|||||
|
 Please Click the above Thumbnail to View/Download
the Methylation Barchart for All Samples
Please Click the above Thumbnail to View/Download
the Methylation Barchart for All Samples
|
||||
|
Anaplastic pleomorphic xanthoastrocytoma |
1 Epigenetic Phenomena Related to This Phenotype | Click to Show/Hide the Full List | |||
|
Epigenetic Phenomenon 1 |
Significant hypermethylation of SLC10A2 in anaplastic pleomorphic xanthoastrocytoma than that in healthy individual | ||||
Studied Phenotype |
Anaplastic pleomorphic xanthoastrocytoma [ICD-11:2A00.0Y] | ||||
The Methylation Level of Disease Section Compare with the Healthy Individual |
p-value: 0.000207949; Fold-change: 0.308247617; Z-score: 1.078355207 | ||||
|
DT methylation level in the diseased tissue of patients
DT methylation level in the normal tissue of healthy individuals
|
|||||
|
 Please Click the above Thumbnail to View/Download
the Methylation Barchart for All Samples
Please Click the above Thumbnail to View/Download
the Methylation Barchart for All Samples
|
||||
|
Third ventricle chordoid glioma |
1 Epigenetic Phenomena Related to This Phenotype | Click to Show/Hide the Full List | |||
|
Epigenetic Phenomenon 1 |
Significant hypermethylation of SLC10A2 in third ventricle chordoid glioma than that in healthy individual | ||||
Studied Phenotype |
Third ventricle chordoid glioma [ICD-11:2A00.0Y] | ||||
The Methylation Level of Disease Section Compare with the Healthy Individual |
p-value: 0.019598972; Fold-change: 0.494329628; Z-score: 1.590747572 | ||||
|
DT methylation level in the diseased tissue of patients
DT methylation level in the normal tissue of healthy individuals
|
|||||
|
 Please Click the above Thumbnail to View/Download
the Methylation Barchart for All Samples
Please Click the above Thumbnail to View/Download
the Methylation Barchart for All Samples
|
||||
|
Brain neuroblastoma |
1 Epigenetic Phenomena Related to This Phenotype | Click to Show/Hide the Full List | |||
|
Epigenetic Phenomenon 1 |
Significant hypomethylation of SLC10A2 in brain neuroblastoma than that in healthy individual | ||||
Studied Phenotype |
Brain neuroblastoma [ICD-11:2A00.11] | ||||
The Methylation Level of Disease Section Compare with the Healthy Individual |
p-value: 8.97E-06; Fold-change: -0.412428984; Z-score: -1.419607336 | ||||
|
DT methylation level in the diseased tissue of patients
DT methylation level in the normal tissue of healthy individuals
|
|||||
|
 Please Click the above Thumbnail to View/Download
the Methylation Barchart for All Samples
Please Click the above Thumbnail to View/Download
the Methylation Barchart for All Samples
|
||||
|
Lymphoma |
1 Epigenetic Phenomena Related to This Phenotype | Click to Show/Hide the Full List | |||
|
Epigenetic Phenomenon 1 |
Significant hypomethylation of SLC10A2 in lymphoma than that in healthy individual | ||||
Studied Phenotype |
Lymphoma [ICD-11:2B30] | ||||
The Methylation Level of Disease Section Compare with the Healthy Individual |
p-value: 0.000117588; Fold-change: -0.364699294; Z-score: -1.288982168 | ||||
|
DT methylation level in the diseased tissue of patients
DT methylation level in the normal tissue of healthy individuals
|
|||||
|
 Please Click the above Thumbnail to View/Download
the Methylation Barchart for All Samples
Please Click the above Thumbnail to View/Download
the Methylation Barchart for All Samples
|
||||
|
Melanoma |
1 Epigenetic Phenomena Related to This Phenotype | Click to Show/Hide the Full List | |||
|
Epigenetic Phenomenon 1 |
Significant hypomethylation of SLC10A2 in melanoma than that in healthy individual | ||||
Studied Phenotype |
Melanoma [ICD-11:2C30] | ||||
The Methylation Level of Disease Section Compare with the Healthy Individual |
p-value: 0.021339239; Fold-change: -0.404032532; Z-score: -1.404625713 | ||||
|
DT methylation level in the diseased tissue of patients
DT methylation level in the normal tissue of healthy individuals
|
|||||
|
 Please Click the above Thumbnail to View/Download
the Methylation Barchart for All Samples
Please Click the above Thumbnail to View/Download
the Methylation Barchart for All Samples
|
||||
|
Multilayered rosettes embryonal tumour |
1 Epigenetic Phenomena Related to This Phenotype | Click to Show/Hide the Full List | |||
|
Epigenetic Phenomenon 1 |
Significant hypomethylation of SLC10A2 in multilayered rosettes embryonal tumour than that in healthy individual | ||||
Studied Phenotype |
Multilayered rosettes embryonal tumour [ICD-11:2A00.1] | ||||
The Methylation Level of Disease Section Compare with the Healthy Individual |
p-value: 2.36E-08; Fold-change: -0.504840461; Z-score: -1.747796179 | ||||
|
DT methylation level in the diseased tissue of patients
DT methylation level in the normal tissue of healthy individuals
|
|||||
|
 Please Click the above Thumbnail to View/Download
the Methylation Barchart for All Samples
Please Click the above Thumbnail to View/Download
the Methylation Barchart for All Samples
|
||||
|
Myxopapillary ependymoma |
1 Epigenetic Phenomena Related to This Phenotype | Click to Show/Hide the Full List | |||
|
Epigenetic Phenomenon 1 |
Significant hypomethylation of SLC10A2 in myxopapillary ependymoma than that in healthy individual | ||||
Studied Phenotype |
Myxopapillary ependymoma [ICD-11:2A00.5] | ||||
The Methylation Level of Disease Section Compare with the Healthy Individual |
p-value: 3.57E-07; Fold-change: -0.467716634; Z-score: -1.499304856 | ||||
|
DT methylation level in the diseased tissue of patients
DT methylation level in the normal tissue of healthy individuals
|
|||||
|
 Please Click the above Thumbnail to View/Download
the Methylation Barchart for All Samples
Please Click the above Thumbnail to View/Download
the Methylation Barchart for All Samples
|
||||
|
Obesity |
1 Epigenetic Phenomena Related to This Phenotype | Click to Show/Hide the Full List | |||
|
Epigenetic Phenomenon 1 |
Significant hypomethylation of SLC10A2 in obesity than that in healthy individual | ||||
Studied Phenotype |
Obesity [ICD-11:5B81] | ||||
The Methylation Level of Disease Section Compare with the Healthy Individual |
p-value: 1.16E-11; Fold-change: -0.314826344; Z-score: -3.16981645 | ||||
|
DT methylation level in the diseased tissue of patients
DT methylation level in the normal tissue of healthy individuals
|
|||||
|
 Please Click the above Thumbnail to View/Download
the Methylation Barchart for All Samples
Please Click the above Thumbnail to View/Download
the Methylation Barchart for All Samples
|
||||
|
Pituitary adenoma |
1 Epigenetic Phenomena Related to This Phenotype | Click to Show/Hide the Full List | |||
|
Epigenetic Phenomenon 1 |
Significant hypomethylation of SLC10A2 in pituitary adenoma than that in healthy individual | ||||
Studied Phenotype |
Pituitary adenoma [ICD-11:2F37] | ||||
The Methylation Level of Disease Section Compare with the Healthy Individual |
p-value: 1.22E-12; Fold-change: -0.315598142; Z-score: -5.463300094 | ||||
|
DT methylation level in the diseased tissue of patients
DT methylation level in the normal tissue of healthy individuals
|
|||||
|
 Please Click the above Thumbnail to View/Download
the Methylation Barchart for All Samples
Please Click the above Thumbnail to View/Download
the Methylation Barchart for All Samples
|
||||
|
Histone acetylation |
|||||
|
Rat liver |
1 Epigenetic Phenomena Related to This Phenotype | Click to Show/Hide the Full List | |||
|
Epigenetic Phenomenon 1 |
Hyperacetylation of Slc10a2 in liver (compare with kidney and cerebrum cells) | [ 13 ] | |||
|
Location |
Promoter | ||||
|
Epigenetic Type |
Histone acetylation | Experiment Method | Chromatin immunoprecipitation | ||
|
Related Molecular Changes |
Up regulation of Slc10a2 | Experiment Method | RT-qPCR | ||
|
Studied Phenotype |
Rat liver | ||||
|
Experimental Material |
Model organism in vivo (mouse) | ||||
|
Additional Notes |
The histone H3 associated with Oatp1b2 promoters was hyperacetylated in the liver but was acetylated very little in the kidney and cerebrum. | ||||
If you find any error in data or bug in web service, please kindly report it to Dr. Yin and Dr. Li.