Detail Information of Epigenetic Regulations
| General Information of Drug Transporter (DT) | |||||
|---|---|---|---|---|---|
| DT ID | DTD0447 Transporter Info | ||||
| Gene Name | SLC6A15 | ||||
| Transporter Name | Sodium-dependent neutral amino acid transporter B(0)AT2 | ||||
| Gene ID | |||||
| UniProt ID | |||||
| Epigenetic Regulations of This DT (EGR) | |||||
|---|---|---|---|---|---|
|
microRNA |
|||||
|
Unclear Phenotype |
3 Epigenetic Phenomena Related to This Phenotype | Click to Show/Hide the Full List | |||
|
Epigenetic Phenomenon 1 |
miR-196b directly targets SLC6A15 | [ 1 ] | |||
|
Epigenetic Type |
microRNA | Experiment Method | CLASH | ||
|
miRNA Stemloop ID |
miR-196b | miRNA Mature ID | miR-196b-5p | ||
|
miRNA Sequence |
UAGGUAGUUUCCUGUUGUUGGG | ||||
|
miRNA Target Type |
Direct | ||||
|
Experimental Material |
Human embryonic kidney 293 cells (HEK293) | ||||
|
Epigenetic Phenomenon 2 |
miR-23a directly targets SLC6A15 | [ 1 ] | |||
|
Epigenetic Type |
microRNA | Experiment Method | CLASH | ||
|
miRNA Stemloop ID |
miR-23a | miRNA Mature ID | miR-23a-3p | ||
|
miRNA Sequence |
AUCACAUUGCCAGGGAUUUCC | ||||
|
miRNA Target Type |
Direct | ||||
|
Experimental Material |
Human embryonic kidney 293 cells (HEK293) | ||||
|
Epigenetic Phenomenon 3 |
miR-23b directly targets SLC6A15 | [ 1 ] | |||
|
Epigenetic Type |
microRNA | Experiment Method | CLASH | ||
|
miRNA Stemloop ID |
miR-23b | miRNA Mature ID | miR-23b-3p | ||
|
miRNA Sequence |
AUCACAUUGCCAGGGAUUACCAC | ||||
|
miRNA Target Type |
Direct | ||||
|
Experimental Material |
Human embryonic kidney 293 cells (HEK293) | ||||
|
Methylation |
|||||
|
Liver cancer |
1 Epigenetic Phenomena Related to This Phenotype | Click to Show/Hide the Full List | |||
|
Epigenetic Phenomenon 1 |
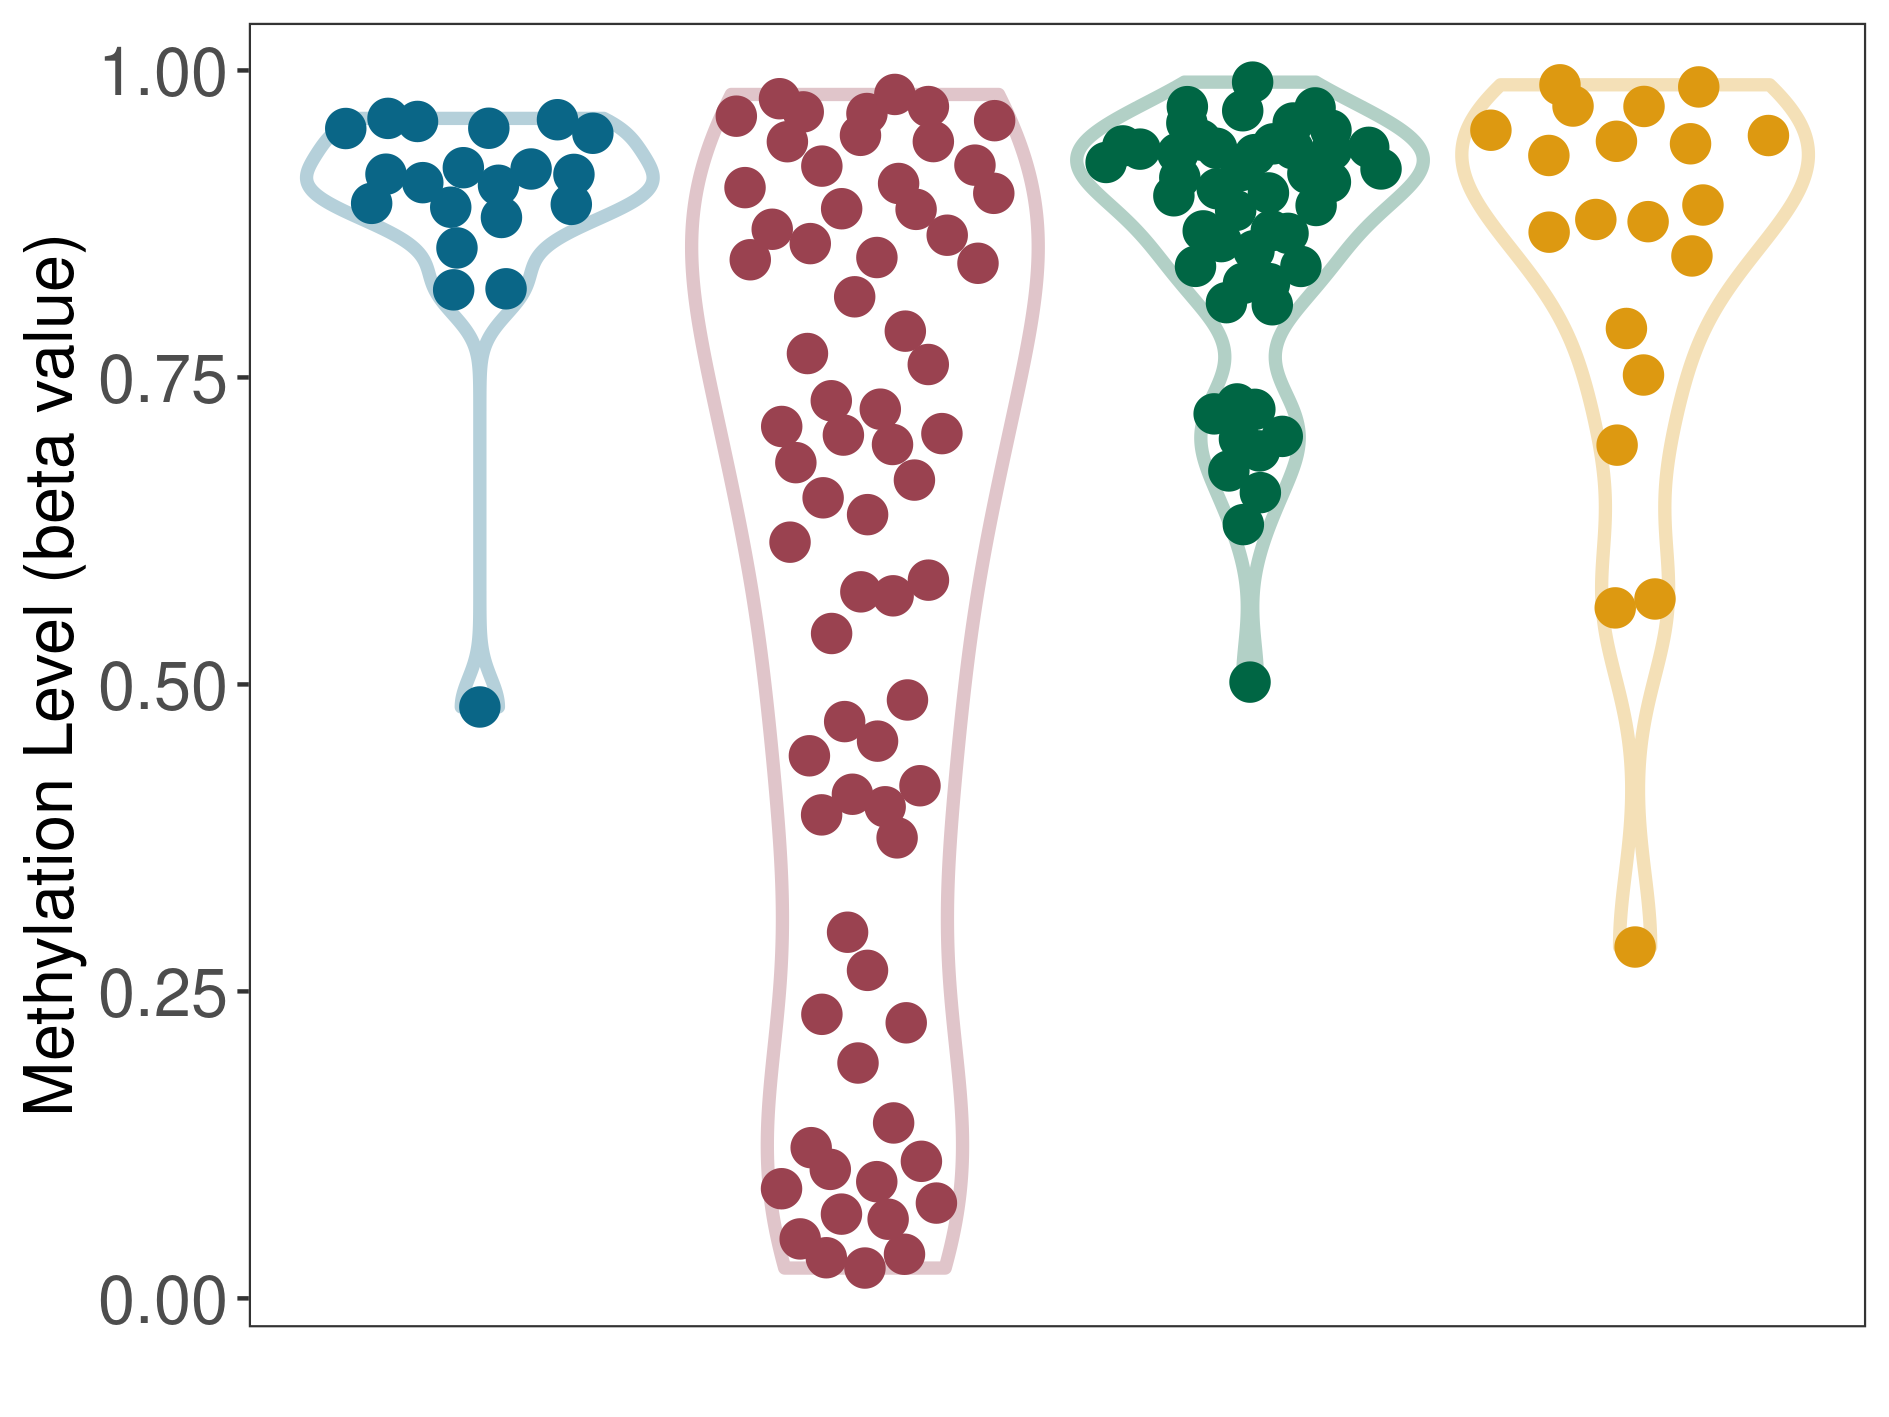
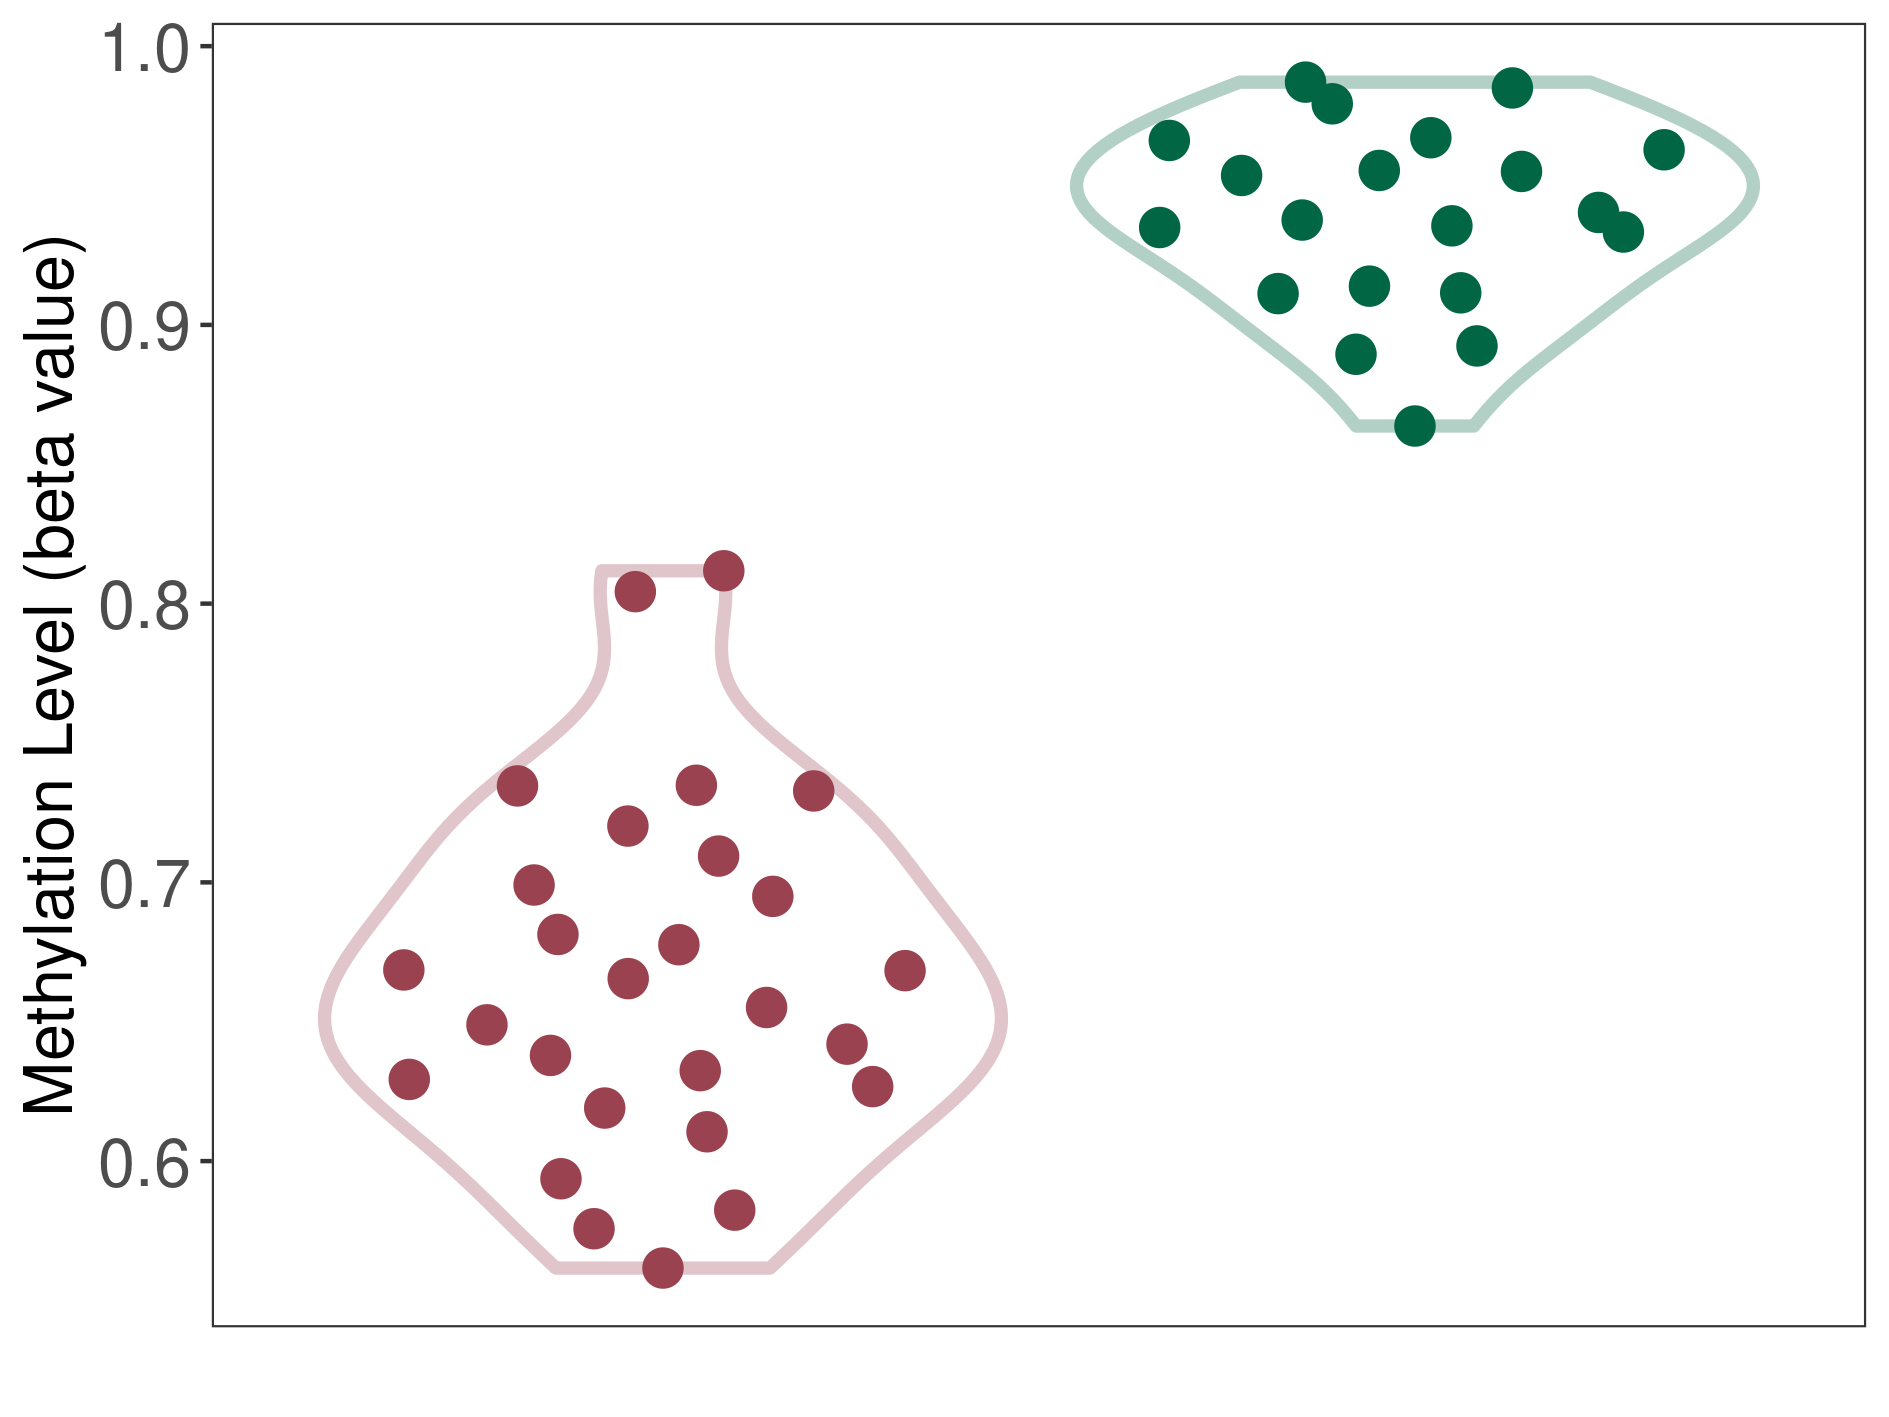
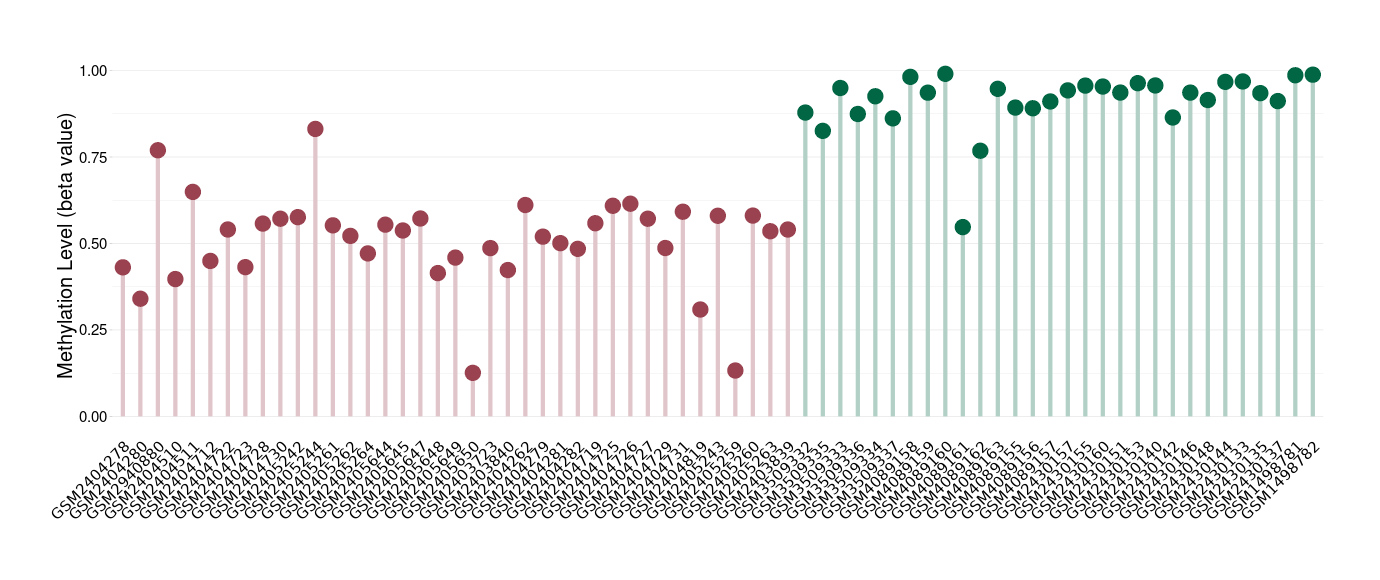
Moderate/significant/moderate hypermethylation of SLC6A15 in liver cancer disease than that in healthy individual/adjacent tissue/other disease section | ||||
Studied Phenotype |
Liver cancer [ICD-11:2C12] | ||||
The Methylation Level of Disease Section Compare with the Healthy Individual |
p-value: 2.08E-09; Fold-change: -0.233870199; Z-score: -2.154887033 | ||||
The Methylation Level of Disease Section Compare with the Adjacent Tissue |
p-value: 1.42E-09; Fold-change: -0.245580553; Z-score: -2.352937216 | ||||
The Methylation Level of Disease Section Compare with the Other Disease Section |
p-value: 3.63E-05; Fold-change: -0.218115996; Z-score: -1.203809636 | ||||
|
DT methylation level in the diseased tissue of patients
DT methylation level in the normal tissue adjacent to the diseased tissue of patients
DT methylation level in the normal tissue of healthy individuals
DT methylation level in tissue other than the diseased tissue of patients
|
|||||
|
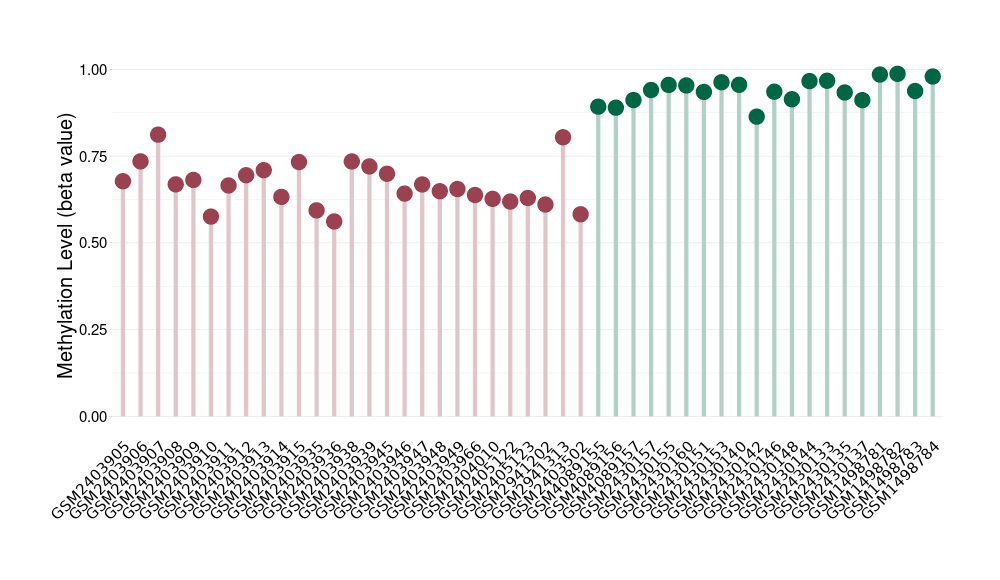
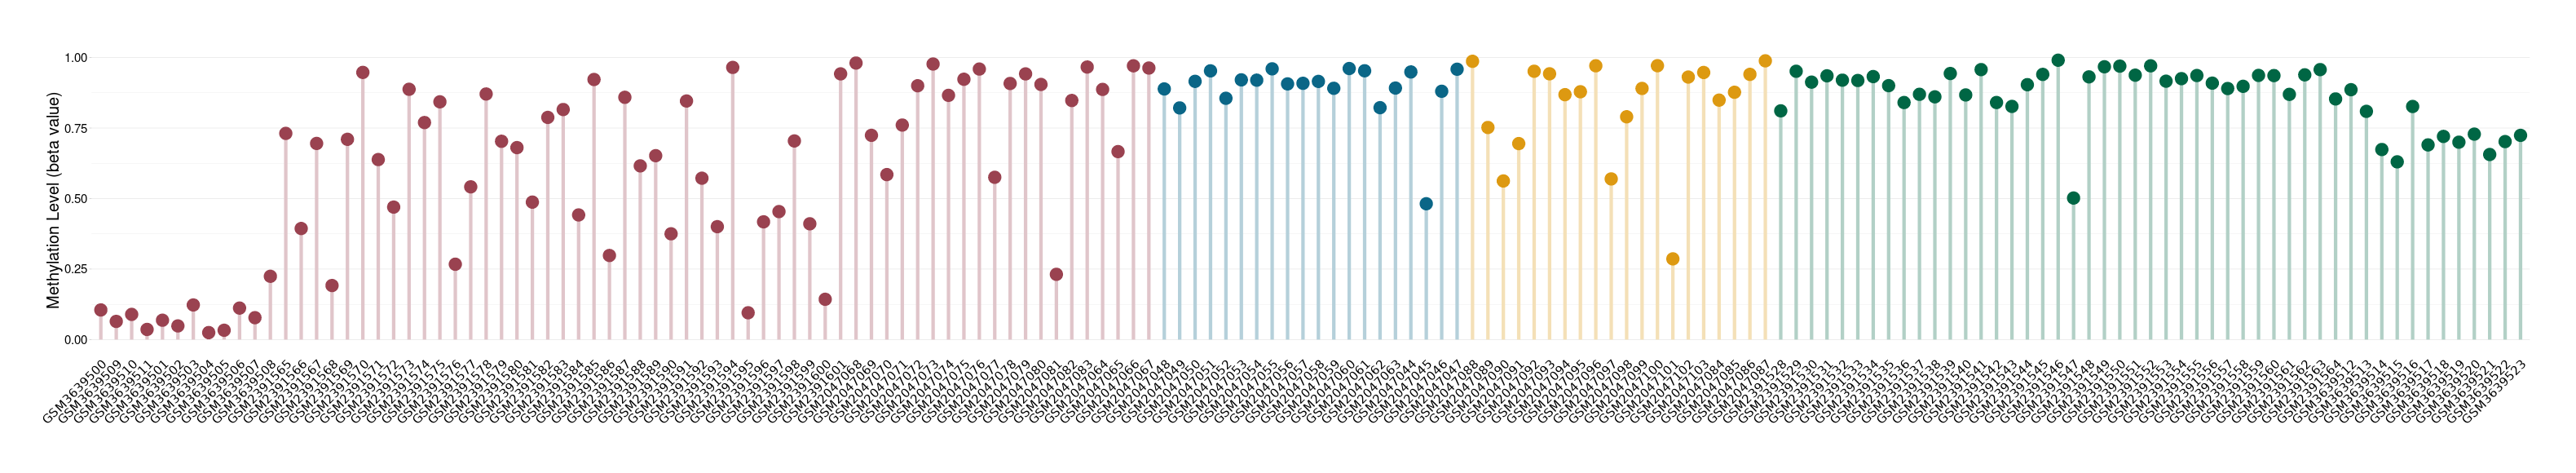 Please Click the above Thumbnail to View/Download
the Methylation Barchart for All Samples
Please Click the above Thumbnail to View/Download
the Methylation Barchart for All Samples
|
||||
|
Craniopharyngioma |
1 Epigenetic Phenomena Related to This Phenotype | Click to Show/Hide the Full List | |||
|
Epigenetic Phenomenon 1 |
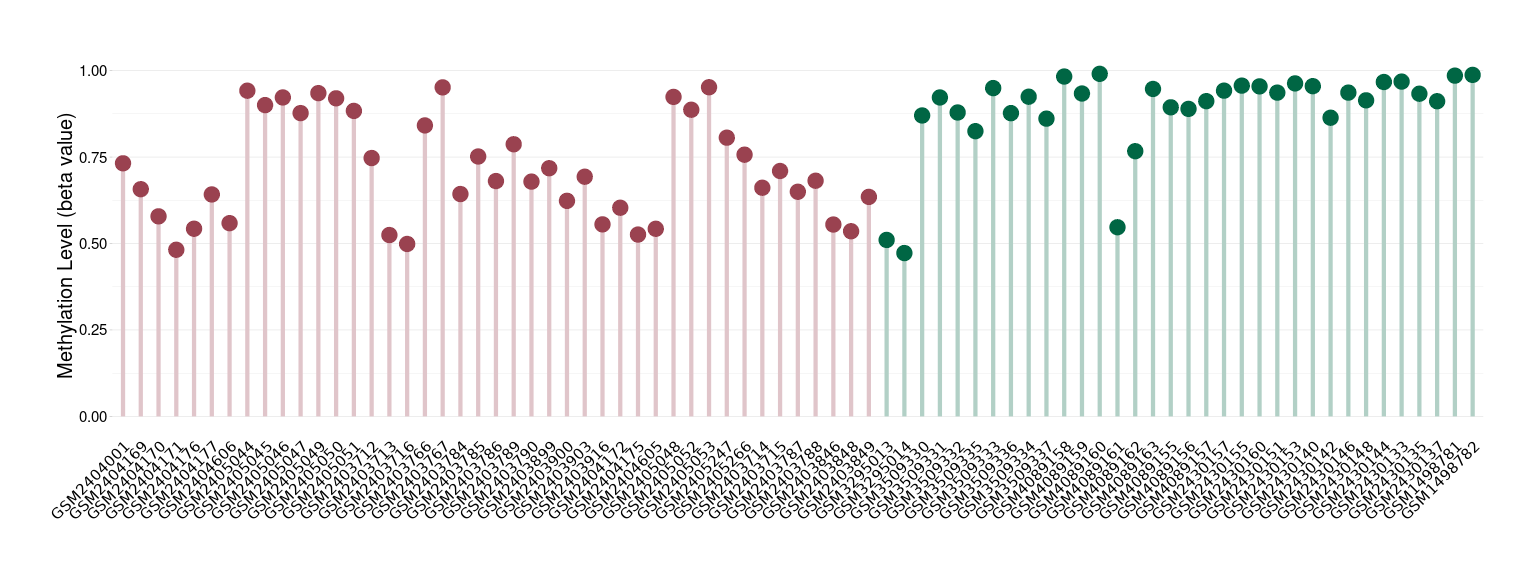
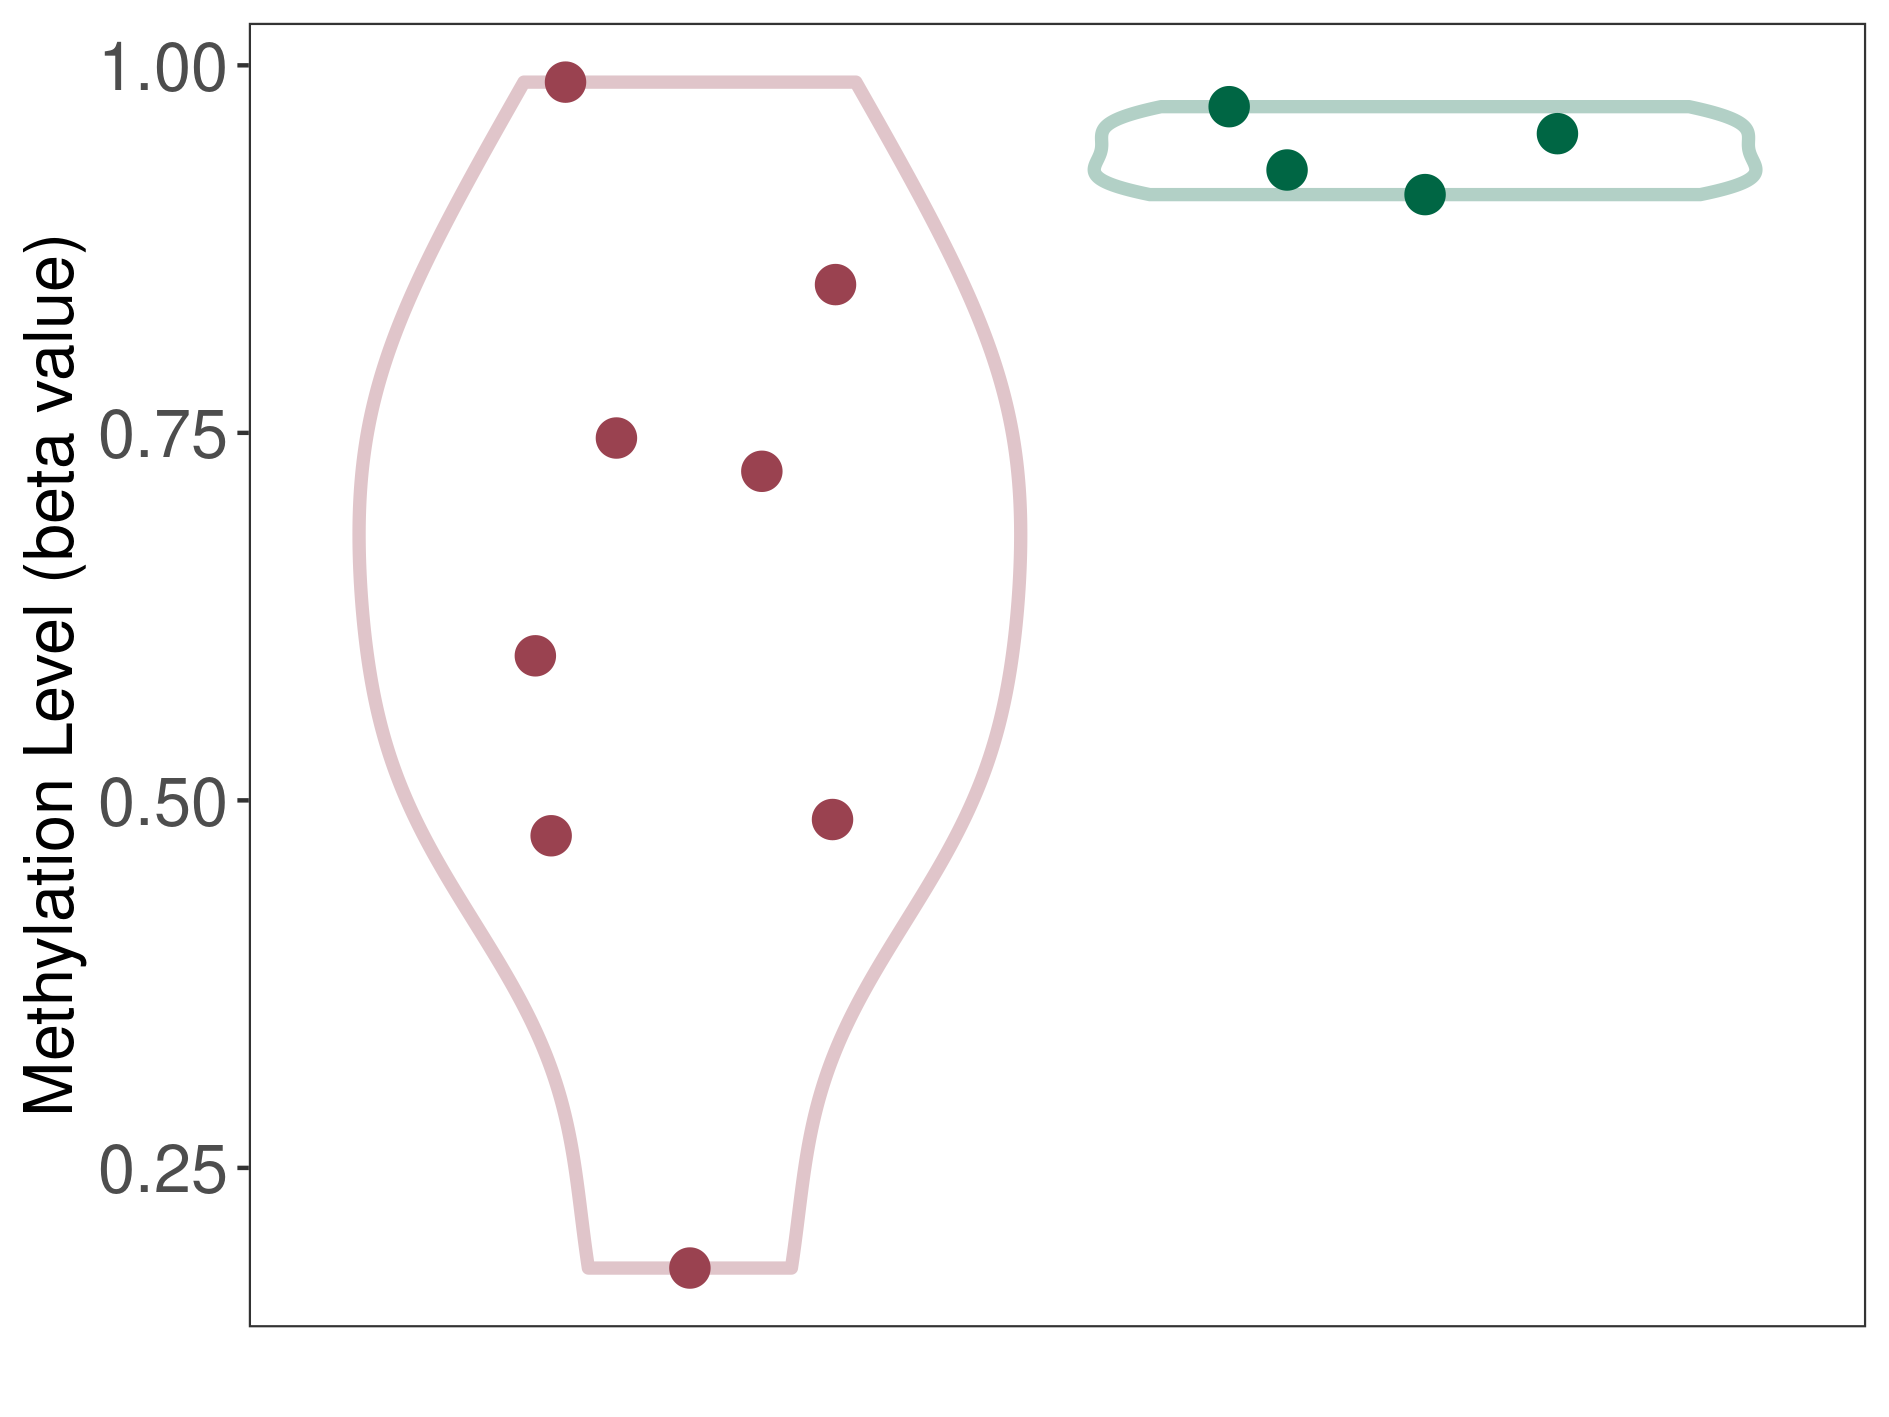
Moderate hypomethylation of SLC6A15 in craniopharyngioma than that in healthy individual | ||||
Studied Phenotype |
Craniopharyngioma [ICD-11:2F9A] | ||||
The Methylation Level of Disease Section Compare with the Healthy Individual |
p-value: 5.47E-07; Fold-change: -0.24734746; Z-score: -1.922651994 | ||||
|
DT methylation level in the diseased tissue of patients
DT methylation level in the normal tissue of healthy individuals
|
|||||

|
 Please Click the above Thumbnail to View/Download
the Methylation Barchart for All Samples
Please Click the above Thumbnail to View/Download
the Methylation Barchart for All Samples
|
||||
|
Hemangioblastoma |
1 Epigenetic Phenomena Related to This Phenotype | Click to Show/Hide the Full List | |||
|
Epigenetic Phenomenon 1 |
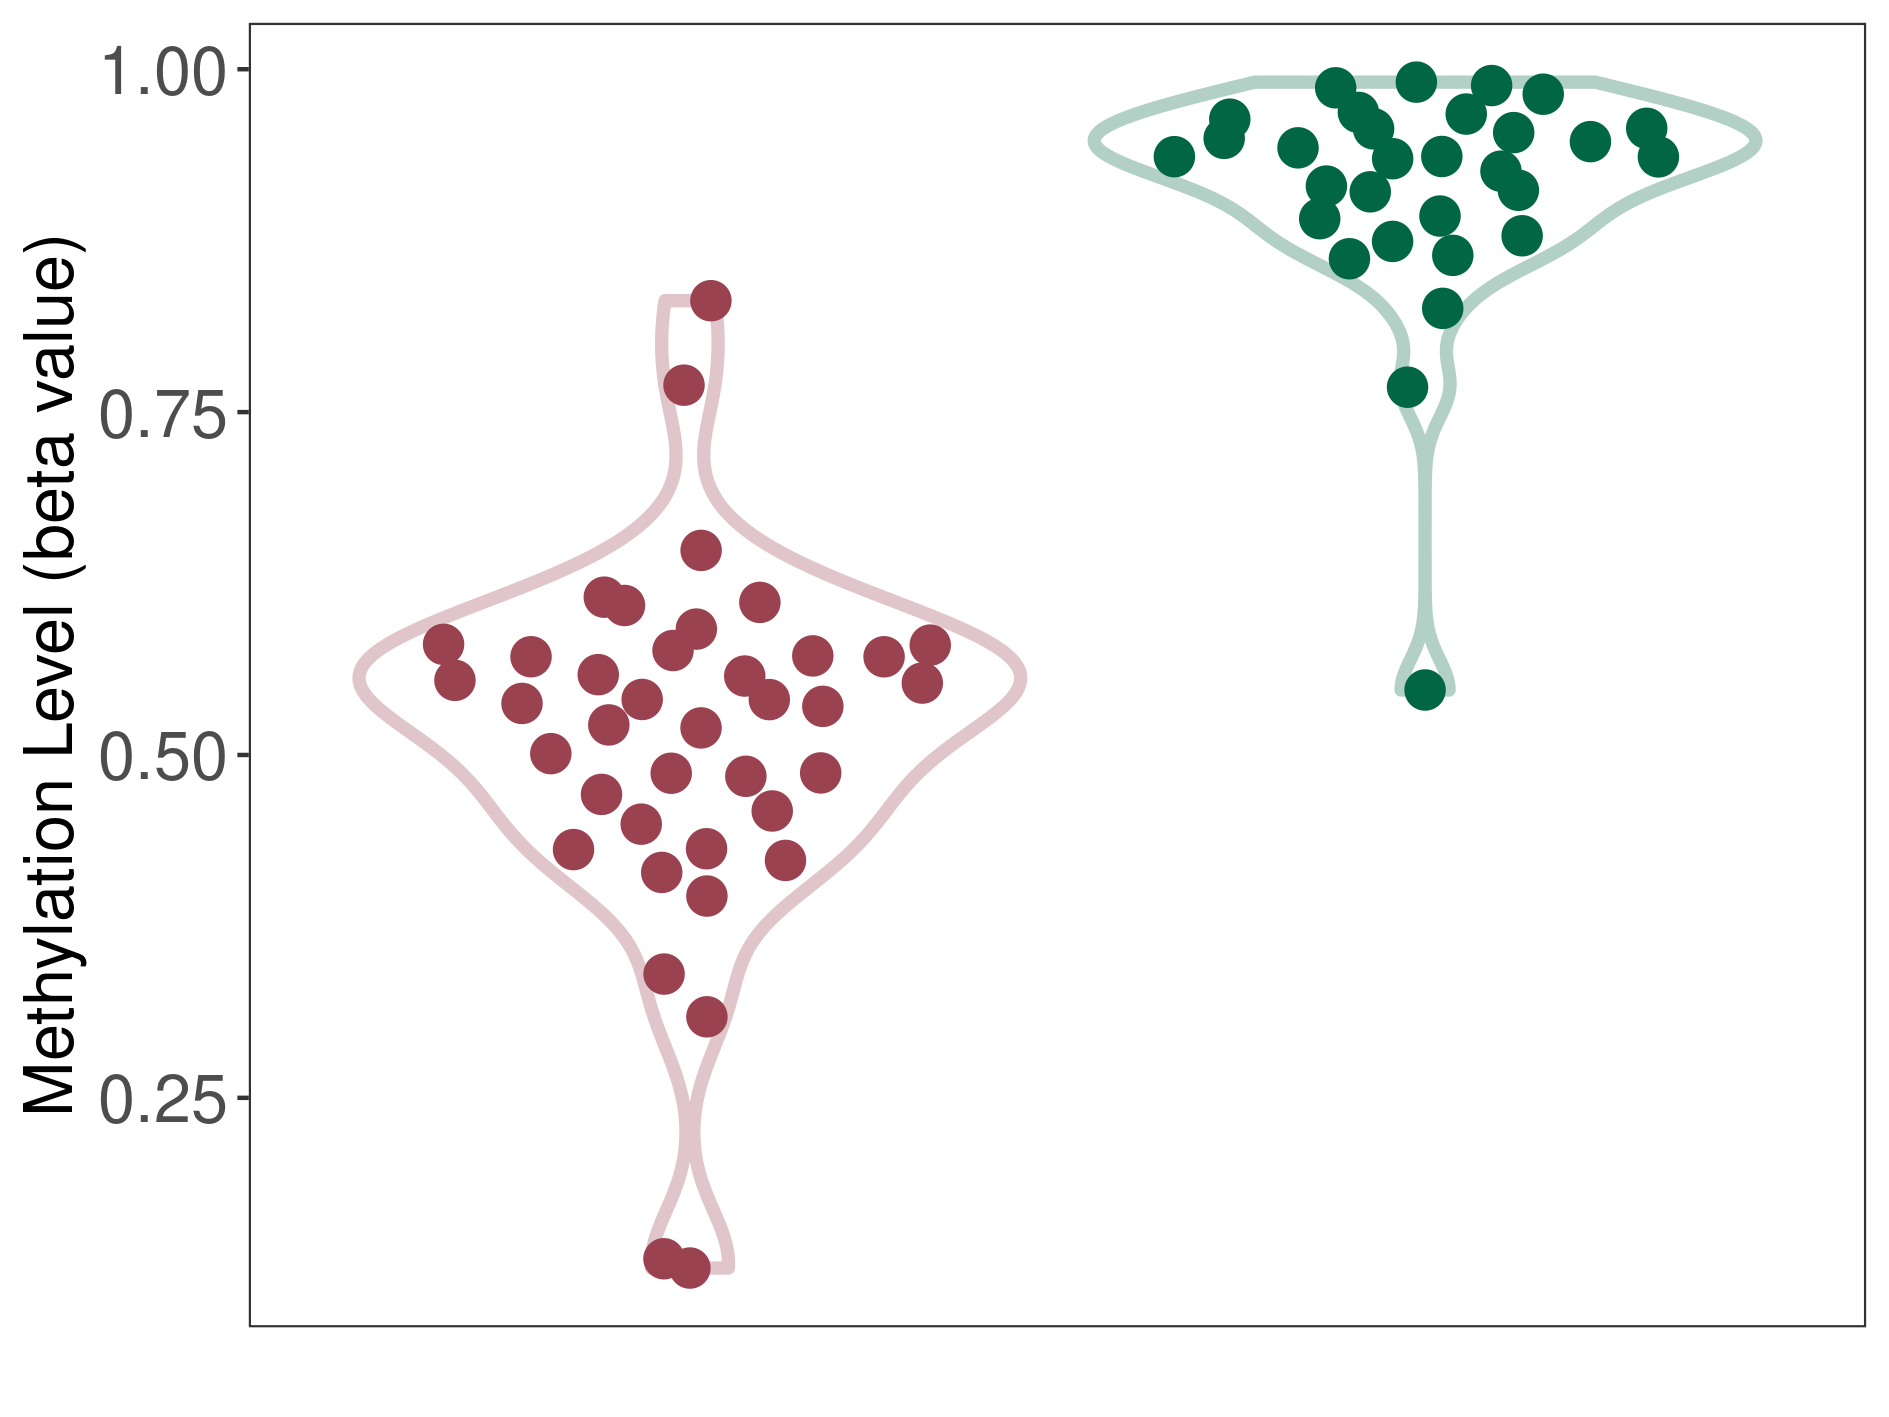
Moderate hypomethylation of SLC6A15 in hemangioblastoma than that in healthy individual | ||||
Studied Phenotype |
Hemangioblastoma [ICD-11:2F7C] | ||||
The Methylation Level of Disease Section Compare with the Healthy Individual |
p-value: 4.74E-22; Fold-change: -0.273511021; Z-score: -8.149424146 | ||||
|
DT methylation level in the diseased tissue of patients
DT methylation level in the normal tissue of healthy individuals
|
|||||
|
 Please Click the above Thumbnail to View/Download
the Methylation Barchart for All Samples
Please Click the above Thumbnail to View/Download
the Methylation Barchart for All Samples
|
||||
|
Prostate cancer metastasis |
1 Epigenetic Phenomena Related to This Phenotype | Click to Show/Hide the Full List | |||
|
Epigenetic Phenomenon 1 |
Moderate hypomethylation of SLC6A15 in prostate cancer metastasis than that in healthy individual | ||||
Studied Phenotype |
Prostate cancer metastasis [ICD-11:2.00E+06] | ||||
The Methylation Level of Disease Section Compare with the Healthy Individual |
p-value: 0.010195649; Fold-change: -0.280070039; Z-score: -10.5997297 | ||||
|
DT methylation level in the diseased tissue of patients
DT methylation level in the normal tissue of healthy individuals
|
|||||
|
 Please Click the above Thumbnail to View/Download
the Methylation Barchart for All Samples
Please Click the above Thumbnail to View/Download
the Methylation Barchart for All Samples
|
||||
|
Esthesioneuroblastoma |
1 Epigenetic Phenomena Related to This Phenotype | Click to Show/Hide the Full List | |||
|
Epigenetic Phenomenon 1 |
Significant hypomethylation of SLC6A15 in esthesioneuroblastoma than that in healthy individual | ||||
Studied Phenotype |
Esthesioneuroblastoma [ICD-11:2D50.1] | ||||
The Methylation Level of Disease Section Compare with the Healthy Individual |
p-value: 4.31E-23; Fold-change: -0.39860235; Z-score: -4.658290284 | ||||
|
DT methylation level in the diseased tissue of patients
DT methylation level in the normal tissue of healthy individuals
|
|||||
|
 Please Click the above Thumbnail to View/Download
the Methylation Barchart for All Samples
Please Click the above Thumbnail to View/Download
the Methylation Barchart for All Samples
|
||||
| References | |||||
|---|---|---|---|---|---|
| 1 | Mapping the human miRNA interactome by CLASH reveals frequent noncanonical binding. Cell. 2013 Apr 25;153(3):654-65. | ||||
If you find any error in data or bug in web service, please kindly report it to Dr. Yin and Dr. Li.