Crystal Structure of This DT
Crystallisation Method: X-ray
Corresponding Chain: A/B
Sequence Length: 22-339
Detail: Struture Info

| General Information of Drug Transporter (DT) | |||||
|---|---|---|---|---|---|
| DT ID | DTD0542 Transporter Info | ||||
| Gene Name | ANXA2 | ||||
| Protein Name | Annexin A2 | ||||
| Gene ID | |||||
| UniProt ID | |||||
| 3D Structure |
Crystal Structure of This DT Crystallisation Method: X-ray Corresponding Chain: A/B Sequence Length: 22-339 Detail: Struture Info |
||||
| Inter-species Structural Differences (ISD) | |||||
| Gallus gallus (Chicken) | |||||
| Gene Name | ANXA2 | ||||
| UniProt ID | |||||
| UniProt Entry | |||||
| 3D Structure |
Method: Homology modeling Teplate PDB: 1W7B_A Sequence Length: 339 Identity: 89.971% |
||||
| Click to Save PDB File in TXT Format | |||||
| Performance | Minimized Score | -1070.527 kcal/mol | |||
| Ramachandra Favored |
Excellent |
||||
| QMEANBrane Quality |
High |
||||
| Ramachandran Plot |
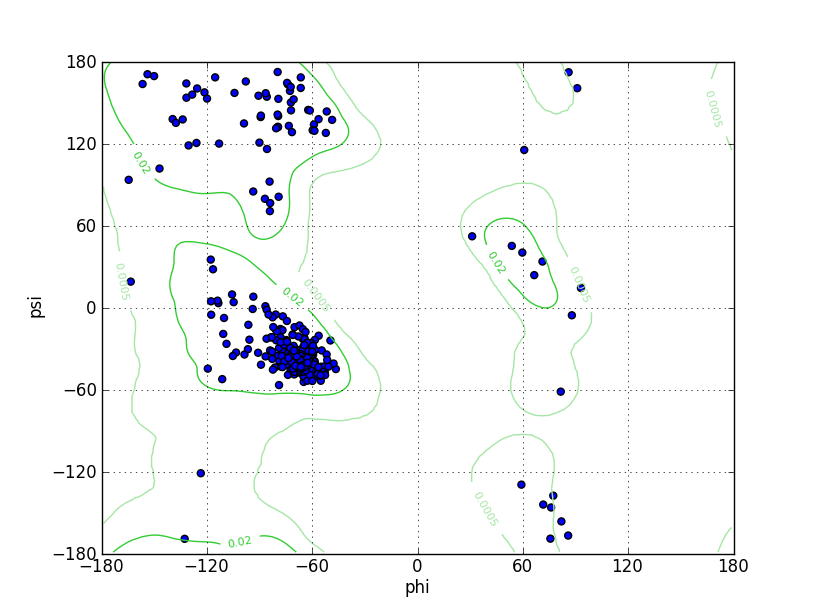
Ramz Z Score: -2.3 ± 0.35 Residues in Favored Region: 332 Ramachandran favored: 98.52% Number of Outliers: 1 Ramachandran outliers: 0.30% |
||||
| Click to Save Ramachandran Plot in PNG Format | |||||
| Local Quality |
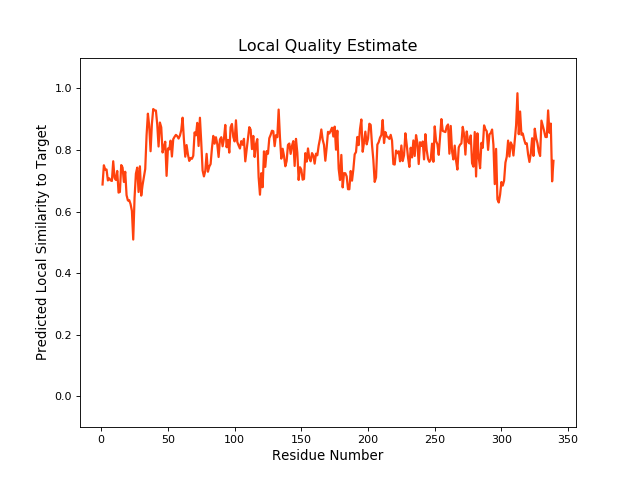
QMEANBrane Score: 0.79 |
||||
| Click to Save Local Quality Plot in PNG Format | |||||
| Experimental Structures of This Model Oganism | |||||
| PDB ID | Scanning Method | Resolution | Expression System | Details | Ref |
| 1BT6 | X-ray | 2.4 Å | N.A. | [ 1] | |
| Structure | |||||
| Click to Save PDB File in TXT Format | |||||
| Corresponding chain | C/D | ||||
| Sequence Length | 2-97 | Mutation | |||
| Inter-species Structural Differences (ISD) | |||||
| Bos taurus (Bovine) | |||||
| Gene Name | ANXA2 | ||||
| UniProt ID | |||||
| UniProt Entry | |||||
| 3D Structure | |||||
| Click to Save PDB File in PDB Format | |||||
| Inter-species Structural Differences (ISD) | |||||
| Ovis aries (Sheep) | |||||
| Gene Name | ANXA2 | ||||
| UniProt ID | |||||
| UniProt Entry | |||||
| 3D Structure |
Method: Homology modeling Teplate PDB: 4X9P_A Sequence Length: 339 Identity: 100% |
||||
| Click to Save PDB File in TXT Format | |||||
| Performance | Minimized Score | -1043.219 kcal/mol | |||
| Ramachandra Favored |
Excellent |
||||
| QMEANBrane Quality |
High |
||||
| Ramachandran Plot |
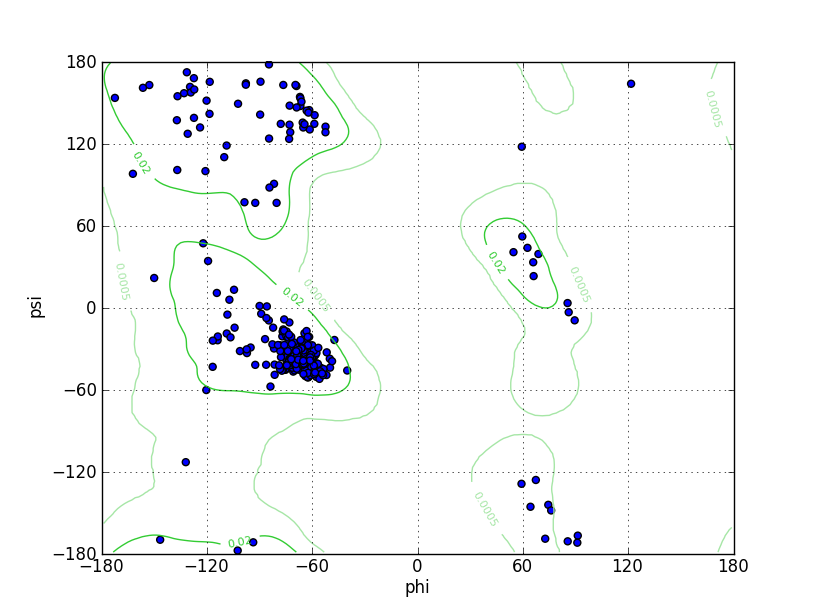
Ramz Z Score: -1.35 ± 0.41 Residues in Favored Region: 331 Ramachandran favored: 98.22% Number of Outliers: 1 Ramachandran outliers: 0.30% |
||||
| Click to Save Ramachandran Plot in PNG Format | |||||
| Local Quality |
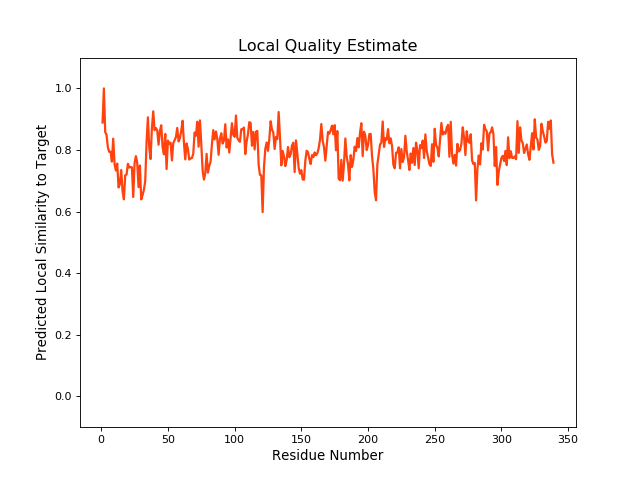
QMEANBrane Score: 0.79 |
||||
| Click to Save Local Quality Plot in PNG Format | |||||
| References | |||||
| 1 | The crystal structure of a complex of p11 with the annexin II N-terminal peptide. Nat Struct Biol. 1999 Jan;6(1):89-95. | ||||
If you find any error in data or bug in web service, please kindly report it to Dr. Yin and Dr. Li.